
For more than three years, stories of insurance rate increases have been front page news in the New York Times, Wall Street Journal, and likely your local news as well.
And consumers can find plenty of “advice” online for how to handle this.
Some financial blogs and industry professionals say that if your net worth exceeds a certain threshold, you can safely skip insurance for things like homeowners coverage or long-term care. The thresholds vary wildly: one popular finance blog pegs it at 10% of your net worth. Other industry professionals say $2 million. Others say $3 million.
Meanwhile, this paper in the Journal of Financial Planning, advises the complete opposite:
“…no rational person would forgo carrying homeowner’s insurance”
These contradictory recommendations point to something missing: a coherent underlying framework to make insurance-related decisions.
This article makes two arguments. The first is that nearly all of the popular advice is anchored to the wrong number.
Net worth is not the figure that determines whether you can afford to self-insure. For retirees in particular, the right number is usually dramatically smaller.
The second is that once you have the right number, you can develop a framework to help you make insurance related decisions regarding your coverage amounts, deductibles, or even what types of insurance are necessary.
Why “Net Worth” Is the Wrong Number
Here’s the problem for a retiree – your net worth is not the same as the amount you can afford to lose.
If you’re retired with a $3 million portfolio, that money isn’t sitting in a vault waiting for an emergency, it’s funding your entire retirement.
Living expenses for the next 25 years, healthcare costs, helping your kids or grandkids, vacations, charitable giving, and every other financial goal you have are being funded by that portfolio. Most of that $3 million is already spoken for.
Losing $600,000 of that $3 million wouldn’t bankrupt you. But it would very likely change your retirement in ways you’d feel for the rest of your life: reduced spending, deferred goals, and increased anxiety about running out of money.
The Number That Actually Matters: “Risk Capital”
If net worth is the wrong number, what’s the right one? We’ll use a concept we call Risk Capital.
This is the portion of your portfolio that can absorb a loss without changing your financial plan.
Good financial planning includes what’s called guardrail analysis, a calculation that determines the portfolio level at which your spending would need to be reduced. Think of the lower guardrail as a floor. If your portfolio drops below this level, something in your lifestyle has to change.
Risk Capital is simply the distance between where your portfolio is today and that lower guardrail. It’s the amount you could lose from a market crash, a lawsuit, a home destroyed by a hurricane, or any other catastrophe, without your retirement plan fundamentally changing.
For most retirees, this number is dramatically smaller than their total net worth.
A Real Example: The $3 Million Couple
Let me show you how this works with a couple we’ll call Tom and Linda.
Tom and Linda are recently retired. They have a $3 million investment portfolio and are withdrawing about $150,000 per year for living expenses. They also have several large goals ahead – helping grandkids with college, future healthcare expenses, and travel.
They own a home in Florida worth $600,000, with no mortgage. Their homeowners insurance has climbed to $8,500 per year, and they’re wondering whether they should drop it.
The Net Worth View:
Total assets: $3.6 million ($3M portfolio + $600K home). The popular advice says they’re well above any self-insurance threshold.
The Risk Capital View:
When we run Tom and Linda’s financial plan through guardrail analysis, we find that their lower guardrail — the portfolio level that would trigger meaningful changes to their retirement plan — is approximately $2.3 million. That means their Risk Capital is:
$3,000,000 − $2,300,000 = $700,000 in Risk Capital
Not $3 million. Not $3.6 million. $700,000. That’s the amount that can actually be put at risk without changing how Tom and Linda live.
Now consider what happens if their home is destroyed. A $600,000 loss would consume nearly 90% of their Risk Capital, putting them right at the edge of needing to cut spending for the rest of their retirement.
So with this number now known, should Tom and Linda drop their $8,500 per year homeowners insurance if they are not willing to gamble their way of life?
It turns out that question was solved almost 300 years ago.
A 300 Year-Old Insurance Dilemma
In 1738, a Swiss mathematician named Daniel Bernoulli published a paper that would become one of the foundations of risk management theory.
But Bernoulli’s original application of this framework wasn’t for optimizing gambling or investing decisions, like we use it for extensively today. It was insurance.
In his paper (starting on page 8 of the linked paper above), Bernoulli describes a merchant named Caius who is shipping goods worth 10,000 rubles from Amsterdam to St. Petersburg. Caius knows that 5 out of every 100 ships on this route are lost at sea, so he looks for insurance to protect his shipment.
He finds an insurer willing to cover the shipment, but the cheapest premium he can get is 800 rubles. Based on the odds alone, Caius calculates that the “fair” price should be about 500 rubles. The insurer is charging substantially more than the actuarially fair price — a figure that should sound familiar to anyone who has opened a homeowners insurance renewal letter recently.
While most of us aren’t insuring merchant ships today, the dilemma is instantly recognizable. You know the insurance is overpriced, but the alternative is absorbing a loss that could change everything.
So, should Caius pay the 800 rubles, or take his chances?
Bernoulli works through the mathematics and arrives at a surprising answer. The answer depends not just on the premium or the odds — it depends on how wealthy Caius is.
Bernoulli shows that if Caius has more than 5,043 rubles in savings (not counting the goods on the ship), he should decline the insurance. If he has less, he should pay the 800 rubles.
Same goods, same odds, same premium, but different answers for people with different wealth levels.
Over two centuries later, a researcher at Bell Labs named John Kelly independently arrived at the same underlying principal, this time applying it to gambling and investing rather than insurance.
His work became widely known as the Kelly Criterion, and today it is a standard tool used by hedge funds and professional investors worldwide for making frequent, repeated bets.
But the core math is Bernoulli’s, and the original problem it solved was insurance.
There’s just one adjustment needed before retirees can use Bernoulli’s formula: Caius’s “wealth” was money he could genuinely afford to lose. For a retiree, that’s not net worth, it’s Risk Capital.
So, let’s plug Risk Capital into Bernoulli’s framework and see what comes out.
How Much Risk Capital Do You Actually Need?
Using Bernoulli’s mathematics, we can compute a specific number for each type of insurance: the Risk Capital Breakeven. This is the minimum Risk Capital you need before self-insuring becomes mathematically rational for that particular policy.
If your Risk Capital is below or near the Breakeven: keep the coverage. The risk is too large relative to what you can afford to lose.
If your Risk Capital is above the Breakeven: the insurance may cost more than the risk is worth to you, and self-insuring becomes a reasonable option.
Like many aspects of financial planning, your risk tolerance needs to make the final verdict in this insurance decision. Just as math can help guide you in how to invest your portfolio, or how much life insurance to buy, the right decision for each person depends on their risk tolerance.
The right way to use the Risk Capital Breakeven is as a sensitivity tool. Compute it, then ask how far your assumptions would have to move before the answer changes.
When the verdict survives every reasonable version of your assumptions, you can act on it with confidence. When the verdict flips inside the range of reasonable assumptions, you’ve learned something equally valuable — that you’re in genuinely close-call territory, where personal risk tolerance should carry the decision.
For Tom and Linda’s homeowners policy, the Risk Capital Breakeven was well above their available Risk Capital:
(The screenshot below uses our interactive Insurance Analysis Calculator, which we link to below)
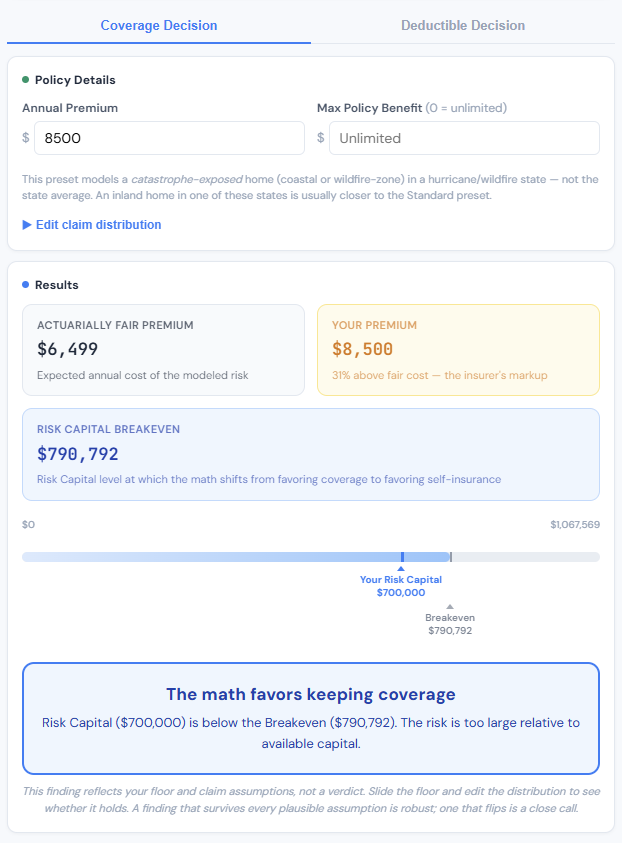
This example shows that even in a scenario when insurance is “overpriced” based on the probabilities and expected claims, maintaining the insurance policy can still be the optimal choice for Tom and Linda.
Tom and Linda’s Long-Term Care Decision
Tom and Linda are also carrying a long-term care insurance policy with a $5,500 annual premium and a $250,000 shared benefit pool. They’re asking the same question they asked about homeowners insurance: is this policy still worth the premium?
The net worth view:
Their total assets are $3.6 million. Every self-insurance rule of thumb they’ve seen online says they can comfortably drop LTC coverage.
The Risk Capital view:
However, their Risk Capital is still $700,000.
When we run the numbers through the same framework we used for homeowners, the answer is immediate:
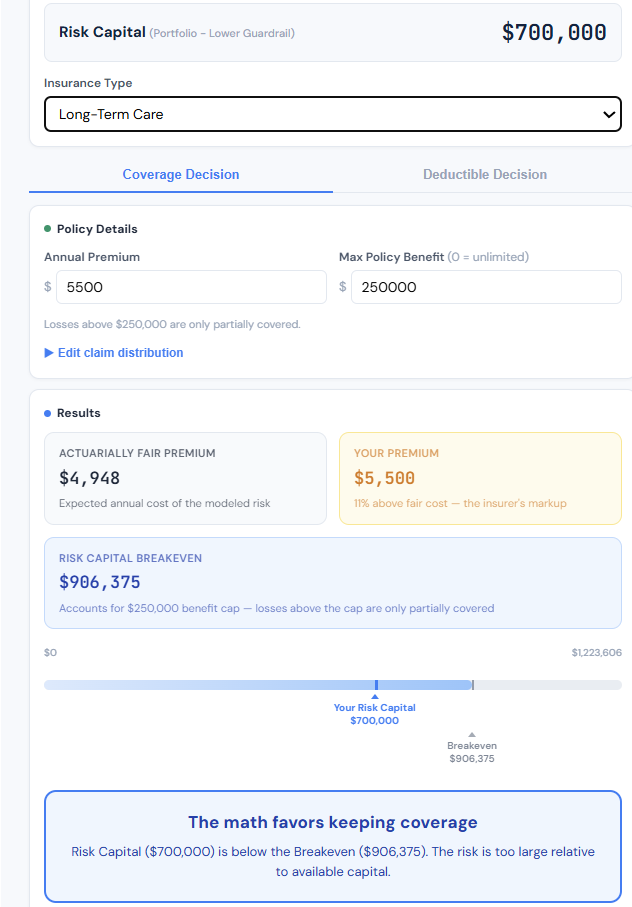
The Breakeven is $906,375, well above Tom and Linda’s $700,000 in Risk Capital. They would need roughly $200,000 more in Risk Capital before the math even begins to suggest that self-insuring is rational.
And, an interesting note for those evaluating keeping old, “unlimited benefit” policies – if Tom and Linda’s policy had an unlimited benefits pool, the Breakeven would be over $2.27 million in Risk Capital.
Compare that to the popular advice that says $2 million in net worth is enough to self-insure. Those aren’t even measuring the same thing. Net worth of $2 million might translate to only $300,000–$500,000 in Risk Capital once you account for the spending the portfolio needs to fund.
Why the Long-Term Care Breakeven Is So Much Higher
Two reasons. First, the probability of needing care is much higher. Total destruction of a home is extraordinarily rare, and the costs of those catastrophic tail risk events are fixed at a relatively known cost.
But about 2.5% of retirees each year will begin a long-term care episode of some kind — roughly 12 times more likely than a total home loss. The framework treats likely events very differently from unlikely ones.
Second, the tail costs are more severe. An extended dementia scenario can cost $550,000 to $850,000. Even with a $250,000 benefit cap, Tom and Linda would still be exposed to $300,000–$600,000 in uncovered costs above the cap.
What Should My Insurance Deductibles Be?
The framework doesn’t just answer the ‘should I have this coverage’ question. It also answers one that comes up even more often: should I choose the lower deductible or the higher deductible?
When you choose between a $1,000 deductible and a $10,000 deductible, you are really making a mini insurance decision.
The lower deductible costs more in annual premium, but covers losses in the $1,000–$10,000 gap that the higher deductible would leave you to pay out of pocket. The premium difference is essentially the price of a tiny insurance policy covering just that gap.
For Tom and Linda’s homeowners policy, the difference between a $5,000 and $20,000 deductible is about $1,300 per year. When we run the same Risk Capital Breakeven analysis on just the deductible gap, the Breakeven comes out to roughly $25,000.
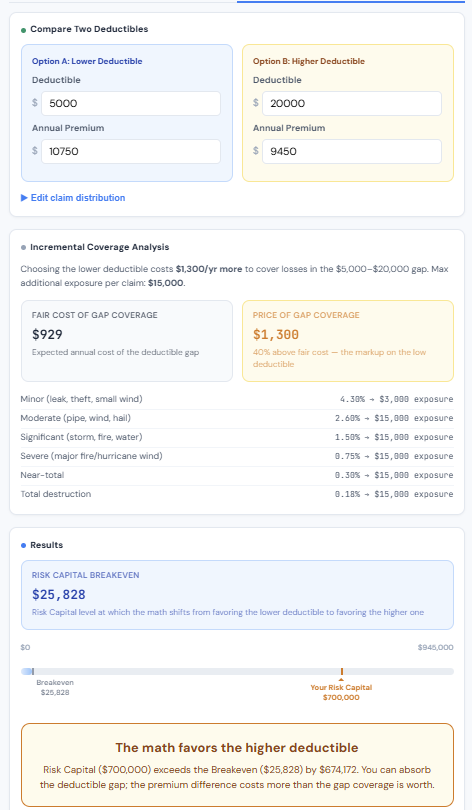
Tom and Linda’s Risk Capital is $700,000, 28 times the Breakeven. They should absolutely take the higher deductible. The $1,300 per year in savings adds up to $13,000 over a decade, and the risk of paying an additional $20,000 out of pocket on a claim is trivial relative to their available risk capital.
This is a general pattern for high net worth households and deductible decisions. Lower deductibles are almost always overpriced from a mathematical perspective, and high net worth individuals can afford the risk.
For anyone with meaningful savings, the higher deductible is usually the better deal. The savings can be redirected to coverage that actually matters at your wealth level, or simply kept in your pocket. But of course, this framework will help ensure your decisions of a higher deductible are mathematically sound.
Try It Yourself
We’ve built an interactive calculator that lets you explore these numbers with your own inputs. You can test both the “should I have this coverage at all” question and the “which deductible” question across several insurance types.
Use Our “Risk Capital Calculator Here
See details on how to use this calculator and the methodology for the default probabilities here.
The calculator uses preset claim distributions based on insurance industry data, which you can customize if you want. Enter your Risk Capital and your premium, and it will show you the Breakeven instantly.
One important note: the calculator can tell you the Breakeven for any policy, but it cannot tell you your Risk Capital. That number comes from your financial plan. It depends on your specific spending, your portfolio, your goals, and your guardrail analysis.
Key Takeaways
A Framework, Not a Rule of Thumb
The purpose of this article isn’t to tell you to drop your insurance or keep it. It’s to show that there is a mathematically sound framework for answering that question.
That framework produces specific, computable answers for each type of insurance, each premium, and each household’s specific financial situation. It replaces vague heuristics like “you’re rich enough to self-insure” with a precise number – the Risk Capital Breakeven.
That’s a meaningful upgrade over the way most of these decisions are made today.
What the Math Generally Shows
When you apply this framework across different types of insurance, a few patterns consistently emerge:
Affluent retirees can almost always benefit from raising deductibles. The incremental premium between a low deductible and a high deductible is almost always overpriced relative to the risk. For Tom and Linda, switching from a $5,000 to a $20,000 deductible on their homeowners policy saves $1,300 per year — money that adds up to $13,000 over a decade. The Risk Capital Breakeven for that deductible decision was only $25,828. Anyone with meaningful savings clears that bar easily. This is one of the simplest, most actionable findings of the entire framework.
Coverage on lower-value assets can often be reduced or dropped. Comprehensive and auto collision coverage, in particular, tends to have a low Breakeven. The combination of modest maximum loss (the value of the car), relatively high claim frequency, and significant insurer markup means that most retirees with substantial Risk Capital are overpaying for this type of coverage.
A multi-millionaire doesn’t need collision insurance on a Honda Accord. The math confirms what common sense suggests, and gives you a specific threshold to point to.
Meanwhile, high-cost, high-severity risks deserve protection far longer than rules of thumb suggest. Long-term care and umbrella coverage both produce Breakevens that are dramatically higher than the “$2 million net worth” thresholds cited in popular media. This is because the tail risks — a catastrophic nursing home stay, or a seven-figure liability lawsuit— are large enough to threaten a retiree’s entire financial plan. The math doesn’t say “never self-insure.” It says “not until your Risk Capital is large enough to absorb the worst case without changing how you live.” For most retirees, that bar is higher than they think.
This Isn’t New Territory for Financial Planning
Conventional wisdom in the financial planning profession is already very comfortable recommending that clients forgo certain types of insurance. When a client retires, we routinely recommend dropping disability insurance because they no longer have earned income to protect. When a client’s children are grown, mortgage is paid off, and surviving spouse has sufficient assets, we recommend dropping term life insurance. Nobody considers these recommendations controversial, they’re simply the logical result of a risk that no longer applies.
The homeowners and long-term care decisions are no different in principle. The question is the same: do you have enough financial capacity to absorb this risk without it changing your life?
For disability insurance after retirement, the answer is obviously yes (the risk doesn’t exist anymore). For collision coverage on a $25,000 car when you have $2 million in Risk Capital, the answer is also yes — it’s just less obvious without the math. This framework makes it equally clear for all scenarios.
The Role of Personal Comfort
None of this means the math is the only factor. Every person has a different relationship with risk.
But consider how the financial planning industry handles this in other areas. Individuals have different comfort levels with investment risk. Some are more conservative, some more aggressive. That doesn’t mean the industry abandons any attempt at portfolio construction. We don’t say “well, it depends on how you feel” and leave it there. We start with a well-researched asset allocation framework, and then we tailor it to the client’s tolerance, goals, and circumstances. The framework gives us a defensible starting point when making decisions. Risk tolerance and personal comfort give us the final answer.
Insurance decisions should work the same way.
If the math says the Risk Capital Breakeven for homeowners coverage is $1.05 million and you have $700,000 in Risk Capital, that’s a clear starting point: keep the policy. If you have $1.2 million in Risk Capital — slightly above the Breakeven — you may still want to keep the policy for peace of mind, that’s a perfectly legitimate choice. But now it’s an informed choice. You know you’re paying for comfort, not mathematical necessity.
The Bottom Line
The goal is not to eliminate insurance whenever possible. The goal is to avoid overpaying to insure risks that are manageable, while preserving protection against losses capable of permanently altering your retirement plan.
The advice to self-insure if you’re wealthy enough isn’t wrong in principle. Bernoulli proved nearly 300 years ago that there is a wealth level at which any insurance policy stops being a good deal.
But the threshold depends on your Risk Capital, the portion of your savings that’s genuinely available to take a hit, not your total net worth. And for most retirees, Risk Capital is dramatically smaller than the number on the account statement.
Your neighbor who dropped their homeowners insurance may have made a perfectly rational decision. Or they may be taking a risk they don’t fully understand. The only way to know which is to compute the actual number.
And that requires a financial plan.
A Few Important Caveats
This framework is powerful, but it’s not the whole picture. A few things to keep in mind:
The floor is an assumption. Everything in this framework flows from where you set your lower guardrail. Reasonable people, and reasonable planners, can land in different places. What’s not reasonable is letting the choice be made silently by default. State your floor, understand what crossing it would actually mean for your life, and test whether your verdict survives moving it.
Some decisions are reversible, others are not. You can drop a homeowners or auto policy and buy it back next year. You may not be able to do that with long-term care insurance. When a decision is irreversible and the math says it’s a close call, the tie should go to keeping the coverage.
Some coverage is legally required. If you have a mortgage, your lender requires homeowners insurance regardless of your wealth. Third-party auto liability is mandatory in nearly every state. The framework applies to optional and excess coverage decisions, not to legal or contractual requirements.
The math doesn’t capture everything. Life insurance can play a role in estate planning. Long-term care policies often come with care coordinators who help you navigate a difficult time. Some insurance provides peace of mind that has real value even when the math says you could go without. These are valid reasons to keep a policy — the framework just ensures you’re making that choice with your eyes open.
Markets and premiums change. Your Risk Capital shifts every year as markets move and you spend from your portfolio. A decision that’s correct today might not be correct after a sustained market decline. This is why the analysis should be revisited annually as part of your financial plan, not treated as a one-time decision.
Worst-case scenarios can happen early. If you self-insure and suffer a total loss in year two, you’ve only saved two years of premiums but absorbed the full loss. The framework already accounts for this since the mathematics heavily penalizes outcomes that destroy a large fraction of your wealth, which is why the Breakevens are as high as they are. But it’s worth understanding that “I’ll save premiums over time” is not the right mental model. The question is: can you absorb this loss right now?
Data sources:
Any insurance analysis requires making assumptions about the likelihood and cost of potential claims. The default probabilities in our calculator are based on industry data from the sources listed below, but reasonable people can disagree about the right numbers for their specific situation. Every input in the calculator can be edited. So if you believe your home is at higher risk than average, or that your health makes long-term care more or less likely, you can adjust the claim distribution and see how the Breakeven changes.
A note on calibration: the standard homeowners preset’s expected loss is calibrated so that its default premium reflects the insurance industry’s typical ~70% loss ratio, with conservative loading on catastrophic outcomes — the same standard you can apply when stress-testing your own inputs. The full methodology, including how we constructed the annual total-loss probability from fire and catastrophe data, is documented separately here:
Standard homeowners insurance methodology
High-risk (hurricane, wildfire areas) homeowners insurance methodology
Homeowners Insurance:
- Insurance Information Institute (III) — iii.org/fact-statistic/facts-statistics-homeowners-and-renters-insurance — The most widely cited consumer-facing source for homeowners claim frequency, average claim amounts by cause (wind, fire, water, theft, liability), and historical trend data. Updated annually.
- National Association of Insurance Commissioners (NAIC) — naic.org —
- National Fire Protection Association (NFPA) — nfpa.org/education-and-research/research/nfpa-research/fire-statistical-reports — Primary source for residential fire frequency and loss data.
Long-Term Care:
- ASPE (Office of the Assistant Secretary for Planning and Evaluation, HHS) — aspe.hhs.gov/reports/ltss-risks-financing-2022 —
- Genworth / CareScout Cost of Care Survey — genworth.com/aging-and-you/finances/cost-of-care — The most widely cited annual survey of home care, assisted living, and nursing facility costs by region; source for episode cost assumptions.
- American Association for Long-Term Care Insurance (AALTCI) — aaltci.org — Publishes annual statistics on claim frequency, duration, premium costs (the Price Index), and the probability of needing care by age and gender.
- LongTermCare.gov (ACL / HHS) — longtermcare.acl.gov — The federal government’s consumer-facing LTC information site. Covers costs, planning tools, and the basics of LTC insurance.
- Morningstar: 100 Must-Know Statistics About Long-Term Care — morningstar.com/personal-finance/100-must-know-statistics-about-long-term-care-2023-edition — An excellent curated compilation of LTC statistics from multiple sources, with clear sourcing.
Auto Insurance:
- Insurance Information Institute (III) — iii.org/fact-statistic/facts-statistics-auto-insurance — Claim frequency and average claim severity by coverage type (collision, comprehensive, bodily injury, property damage). Updated annually.
- NAIC Auto Insurance Database Report — Available through naic.org — State-by-state average premiums, loss ratios, and claim frequency data.

Matt Hylland is a financial planner and partner at Arnold & Mote Wealth Management, where he helps individuals and families make informed decisions around retirement planning, investment management, tax planning, and comprehensive financial strategy. As a flat-fee, fiduciary advisor, Matt focuses on providing objective guidance designed around each client’s goals and long-term financial needs.
Before transitioning into financial planning, Matt worked as a materials scientist for the Department of Defense, bringing a problem-solving mindset and analytical approach to his work with clients. He has been featured or quoted in nationally recognized financial publications, including The Wall Street Journal, CNBC, and Kiplinger, for his insights on personal finance and investing.
Years of experience: 10
Specializations: retirement decisions, tax-efficient strategies, investment choices, and the complex financial decisions that come with major life transitions.