
This is a replay from Arnold and Mote Wealth Management that was recorded in March 2020 during the stock market decline during Covid-19 crisis:
We looked at historical stock market selloffs to see how they compared to the decline after Covid, and looked at options that retirees have in managing their money through the crisis.
While many were panicking and selling investments, we were there to help our clients stay invested in the market and remain calm.
This was the first of our monthly webinar series. You can see more webinar replays and other videos here.
Video Transcript – Investing During Stock Market Volatility
What we want to try and point out over the next 15 or 20 minutes is that the market has always been subject to these ups and downs like we have been seeing today.

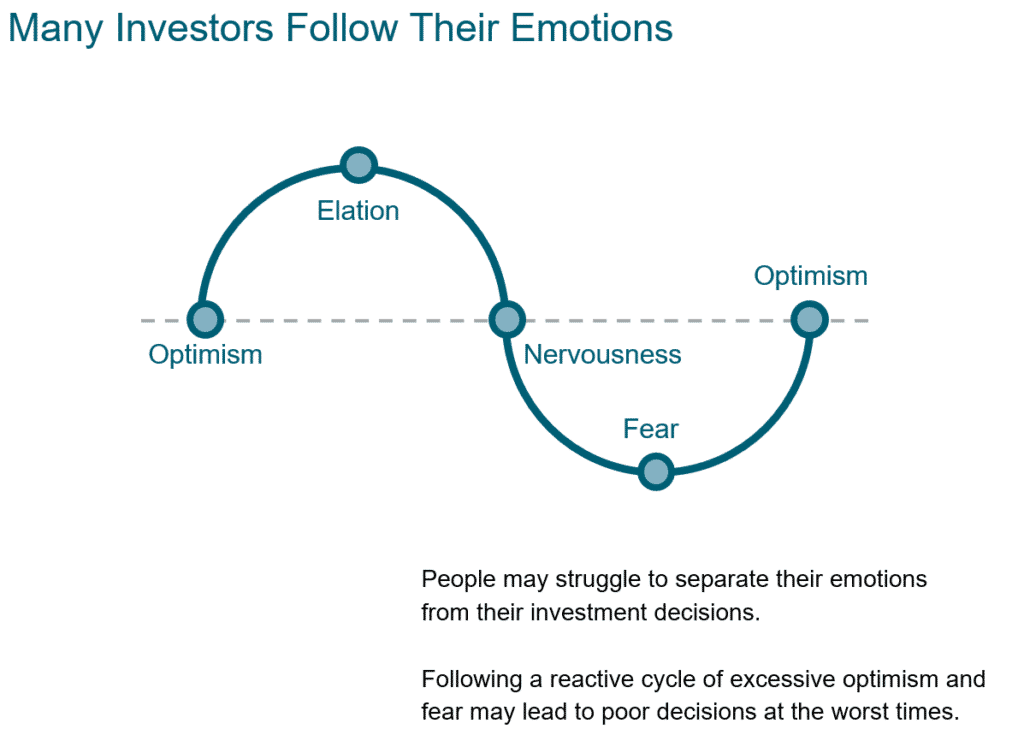
We are going to look at how long these draw downs typically occur, and how far the market has fallen in the past during times like this. But first we wanted to talk about the emotional side of these market swings, and what investors do that gets them in trouble in the long term.
These cycles of ups and downs are normal, and we have seen them many times before. In fact, we know that a couple of those who registered for the call today were sitting down with Eric and Jean 12 years ago, the last time we saw declines like this, and getting through that last cycle together.
Since then, we just had the longest streak without a recession in history, and we certainly went from the fear in 2008 back up to an elation level over the last couple of years.
And now, we are certainly back in the fear stage. On Monday the VIX, which is a measure of stock market volatility and commonly referred to as the “fear gauge”, reached an all time high, surpassing the levels of late 2008 when Lehman Brothers bank collapsed!
It is completely understandable to feel this fear at times like today. Everyone feels this range of emotions as these cycles come and go….
But, we think that it is important to know that where investors have done permanent damage to their long term retirement plans is by acting on their emotions in times like we are seeing today, and making very large, drastic changes to their investments during times of fear like we are now in.
And we see this cycle of greed and fear reflected in real world data:

This is a chart of the performance of a worldwide stock index in red, with the performance on the right axis, overlayed against what is called the flow of funds into stock mutual funds, which is the brown bars you see. Bars that go up represent new cash flowing into stocks, bars going down reflect investors pulling money out of stocks and moving it to either bonds or cash.
And what we see is that same up and down cycle of greed and fear, and how investors react.
Investors let the emotions of both elation and fear impact how they invest. These fund flows match up very well with how the market has gone up and down in times of market volatility.
We don’t know the total amount that investors have pulled out of stock funds during this crisis yet,
But we know today’s levels of fear is on par or even in excess of 2008 and all signs point to investors pulling out funds from stocks at the same rate as the depths of 2008.
And you will notice in 2008 that as the stock market was falling, investors were moving an incredible amount of money from stocks to bonds and cash. This also coincided with the bottom of the market, and was right before what would become the longest bull market in history.
I just mentioned that we are about as deep into the “fear” trough as we get today, rivaling the depths of the 2008 financial crisis. Late 2008 forced many investors to sell out and move their investments to safer assets, and today’s fear is doing the same. I don’t think its any coincidence that late 2008 was of course a terrible time to sell, and instead an excellent time to buy.
Today we are seeing the same levels of fear and selling as we did 12 years ago, and we think that over the long term, panic selling today will seem as bad of a decision as panic selling in 2008 sounds today.

So, we know that historically investors try and time the market, and based on fund flows we know a lot of investors sell out as the market declines, and buy in after the market goes up.
And even as we have seen recently, the problem with selling during market declines is that some of the market’s best days have come during these times of stress and fear. So, without perfect timing, which is nothing but luck, we know that trying to time these swings in the market will cause you to miss some of these big up days in the market.
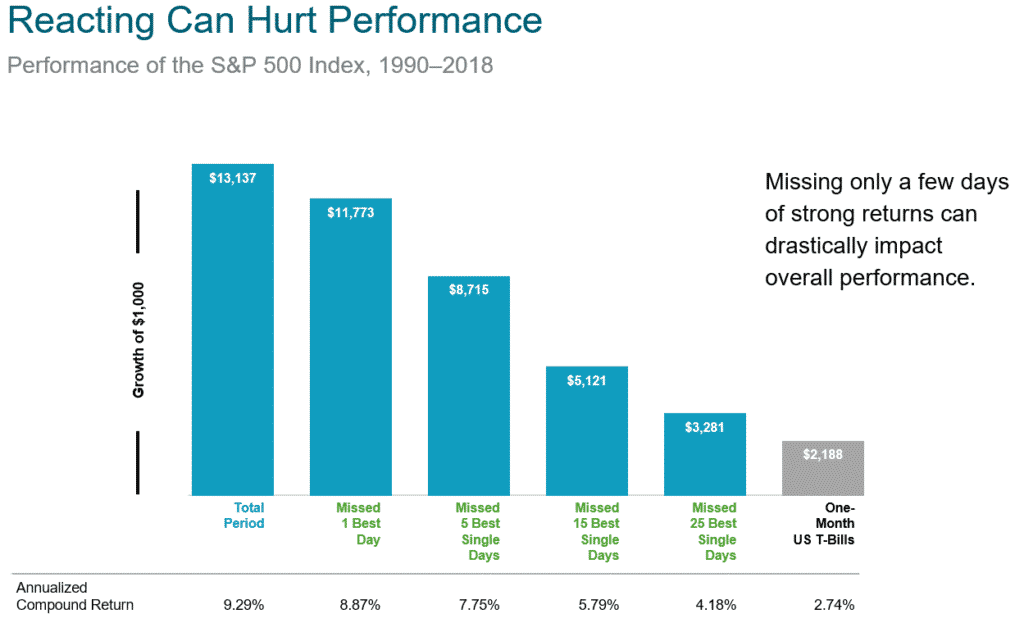
This chart shows the growth of a $1,000 investment over a 30 year period, and the performance you would have had, if you missed a select number of the market’s best days. This chart just includes the time from 1990 to the end of 2018, and does not include the most recent drop.
If you invested $1,000 into the S&P 500 and walked away for 30 years, you would have come back to just over $13,000. Your average annual return over that time would have been about 9.3% per year.
If you cashed out and missed just the best day in the stock market over that time, you would have cost yourself about $1,500 on the growth of that original $1,000 investment.
And we can keep going. If you missed the 5 best days, your returns suffer even further. I think its worth noting, that all 5 of these days occurred in either 2008 or 2009. So, if you were going in and out of the market in 2008 and 2009 and missed these days, you hurt your long term performance significantly.
If you missed more of the best days, your returns fell further. All of the top 15 best performing days in the stock market occurred in either 2008/2009, in 2002 at the bottom of the dot-com bubble, or 1997, a period which many forget about now, but a time that is known as the Asian flu, which was the first time in history that US stock market circuit breakers were tripped and trading was forced to stop on the New York Stock Exchange. If you cashed out during those volatile days in 1997, you missed two of the best days in recent stock market history, and would have hurt your long term performance.
And finally, the top 25 days. If you missed these days your returns in the stock market begin to approach that of simply investing in t-bills.
Every single one of these 25 days except for 1 occurred in a bear market.
The only day in this top 25, that was not in a bear market was December 26th, 2018. Which we may have forgotten about by now, but the market dropped 19% very rapidly at the very end of 2018. This day was the start of the rebound. The other best 24 days all occurred when the stock market was in a period of fear and high volatility. …
So, moral of the story and the point to take home from this slide is – If you want the historical returns that the stock market has provided – you have to be in the market. Unfortunately, that means being in the market during times like we are seeing today, but it also guarantees that you will be in the market when things recover, and it recovers very fast with large returns coming at specific days.
All of the markets best days have occurred in times of volatility. And if you are out of the market at these times, you risk doing permanent long term damage to your portfolio.
And we actually know how investors hurt themselves by trying to go in and out of the market.

This is data from a big annual study in the investment world by a company with the name of DALBAR.
They evaluate these fund flows we were just looking at on a previous slide, and calculate an “average investor return”. Or an average return that is weighted by the flow of new funds into stock funds over time.
These returns represent annualized returns over a 20 year period from 1998 through the end of 2018. So, if you invested in the S&P 500 in January of 1998, and then walked away and never changed anything, you averaged a 5.6% return each year for the next 20 years, which resulted in just about tripling your money over that 20 year period. Now remember this 20 year period includes riding out both the dot-com bubble and the 2008/2009 crisis.
Of course, we don’t have any clients that are exclusively invested in the S&P 500. For safety and stability we add a portion of bonds in the portfolio as well, and as expected, that does reduce the total returns slightly, but returns are still relatively good and volatility was greatly reduced, which helps out in times like we are seeing today.
Then, what we see is the DALBAR data, which tells us that the large majority of new money goes into investment funds, and out of investment funds, at the exact wrong time.
The average investor achieves returns in the stock market that is far below that of the stock market, or even a diversified portfolio.
If you take anything away from this webinar, I think it should be this slide. This represents the cost, on average, of investors reacting to their emotions and making big changes to their investment portfolio during times like we are seeing today.
We know that the investment portfolio we put together for clients has worked over these long periods of time, 20-years and longer. But, no investment plan will work when you buy and sell and at bad times throughout the cycle.

All of this information is good, but we also think it helps to know what to expect when you are investing. We know that you feel that fear emotion during times like this, but I think having a historical perspective of the market’s history helps when managing through times like this.
And we have a lot of history of how markets perform. There have been a lot of ups and downs in the stock market. We have seen this fear and elation cycle play out over and over.
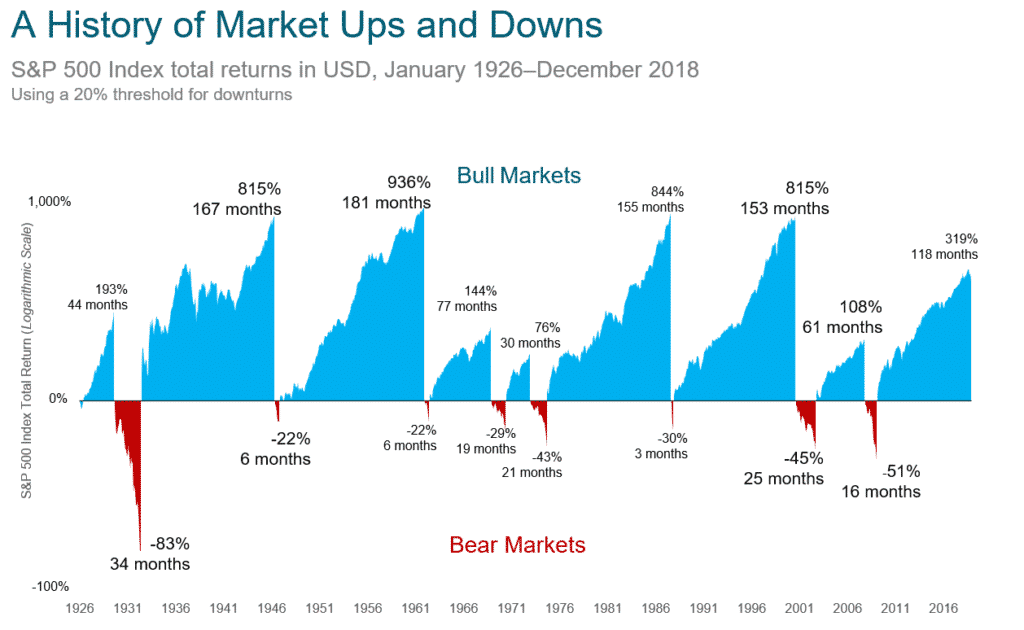
This chart shows the magnitude and duration of stock market moves during some of the best and worst times in stock market history.
The blue in the chart represents the S&P 500’s historical bull markets, or times when the stock market has done well. For example, from the late 1980s until 2000, the S&P 500 rose 815% over a period of 153 months.
The red in the chart represents historical bear markets, or times when the stock market has faced a significant draw down. For example, in 2008 the stock market fell 51% over a period of 16 months.
It has not been updated for this most recent decline yet, but we are sitting at about 28% down right now, and we are 2 months into it.
The magnitude of the decline of this bear market so far is not necessarily unique, you can see the last 2 bear markets have been much worse than what we have experienced so far. But the speed of the current decline has been unique. Historically, it has usually taken more time to get to a 30% drawdown.
A couple things to note from this slide:
The Drawdowns are always fast compared to the subsequent bull markets.
The average bear market decline is 16 months in length. Bear markets are almost always violent, quick drops in the stock market. It is not unusual that in a matter of months a bear market takes away what took years for a bull market to do.
The average bull market is 118 months in length. But they are always slower grinds higher.
The old saying is that bears take the elevator, and bulls take the stairs. And that is certainly shown here.
We know, as we have shown in the last few slides, despite all of this turmoil and cylces between fear and elation, that investors who have stuck with a long term plan have had great returns. But, that means sticking with that plan through some pretty rough periods.
I also think this chart also helps show why these declines feel so bad and cause so much fear so quickly. On average, we go 10 years in between bear markets. So, we get used to 10 years of quiet, less volatile periods, and then all of a sudden we get plunged into a recession very quickly.
We know there has been many periods of uncertainty in the market’s history, and many bear markets.
But, we know that the stock market has also always produced good returns after these crises are over.


On this slide, we are looking at the returns of a 60/40 investment portfolio, 60% in stocks, 40% in bonds. And, knowing who is on the call today – we know this is close to the type of portfolio you are in.
This is looking at the 1, 3, and 5 year returns of a 60/40 portfolio after some significant events in the last 30 years.
So, for example, Black Monday 1987, when the stock market fell 23% in one day – which is equivalent to about 5,000 points on the Dow today – 1 year later a 60/40 portfolio was up 19%, 3 years later it was up 33% and 5 years later it was up 76%.
More recently, the panic of 2008. A 60/40 portfolio was actually positive 1 year after the collapse of Lehman Brothers despite how bad it was at that time, and began to rise significantly 5 years later.
Notice that this represents a pretty wide variety of events. From single days of very bad events, such as 9/11, to very long economic recessions like 2008. Regardless of the type of event, the market has rebounded and produced decent returns for the long term investor.
And by long term here, we want to be clear we are talking 5 years or more. Even periods of 1-3 years are not guaranteed for positive returns. But, all of you will be around and still investing in 5 years, and that’s why we keep a portion of your investments in equities, because despite the volatility like we have seen recently, we know that over long time periods we will see positive returns again.
Despite all the turmoil, a long term investor that has stuck to their plan has achieved exceptional returns over time.
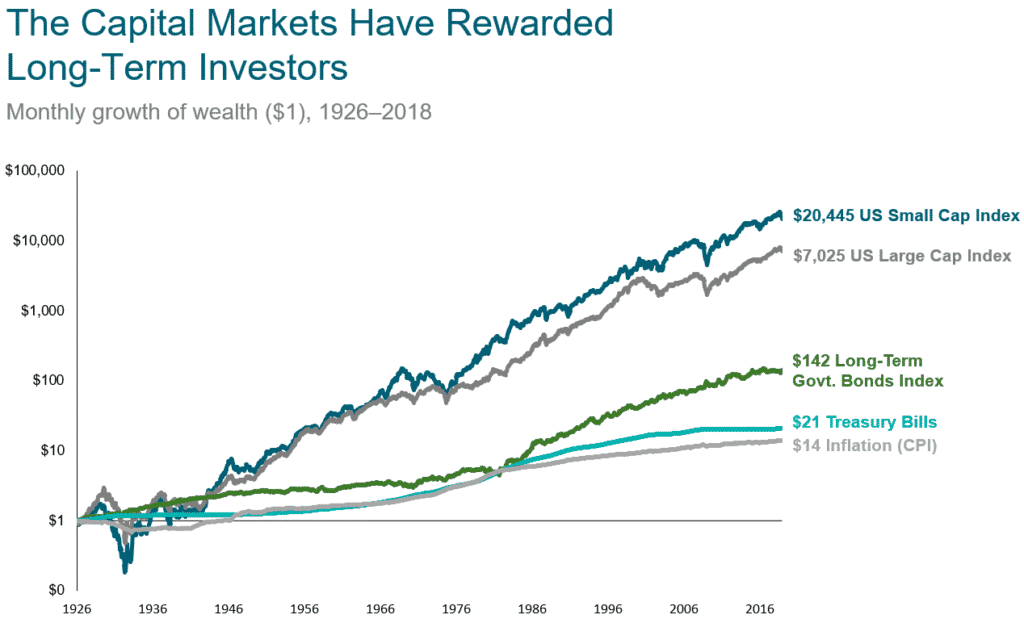

This chart shows the growth of $1 in investments since right before the great depression in various assets.
Over the long term, small company stocks have performed very well. Its worth noting they have also been much more volatile. But, an investor that has stuck with small company stocks over long periods of time has performed very well.
Stocks have done great, Bonds have done pretty well too and maybe more importantly provided a very good ballast for times like we are seeing today, and made it easier for you to hold stocks for the long term.
And within this long term performance is a lot of very significant events.
I’m paraphrasing a Warren Buffet quote here, but he points out that
In the 20th Century, we dealt with two world wars (one of which we initially appeared to be losing); a dozen or so panics and recessions; double digit inflation rates in 1980; and the Great Depression of the 1930s, and unemployment rates that ranged between 10% and 25% for many years.
But, Without fail, we’ve overcome them. In the face of those obstacles – and many others – the real standard of living for Americans improved nearly seven-fold during the 1900s, and the Dow Jones Industrials rose from 66 to 11,000.
And of course now, even after this most recent decline, the Dow is right around 20,000. Really incredible returns that long term investors have achieved.
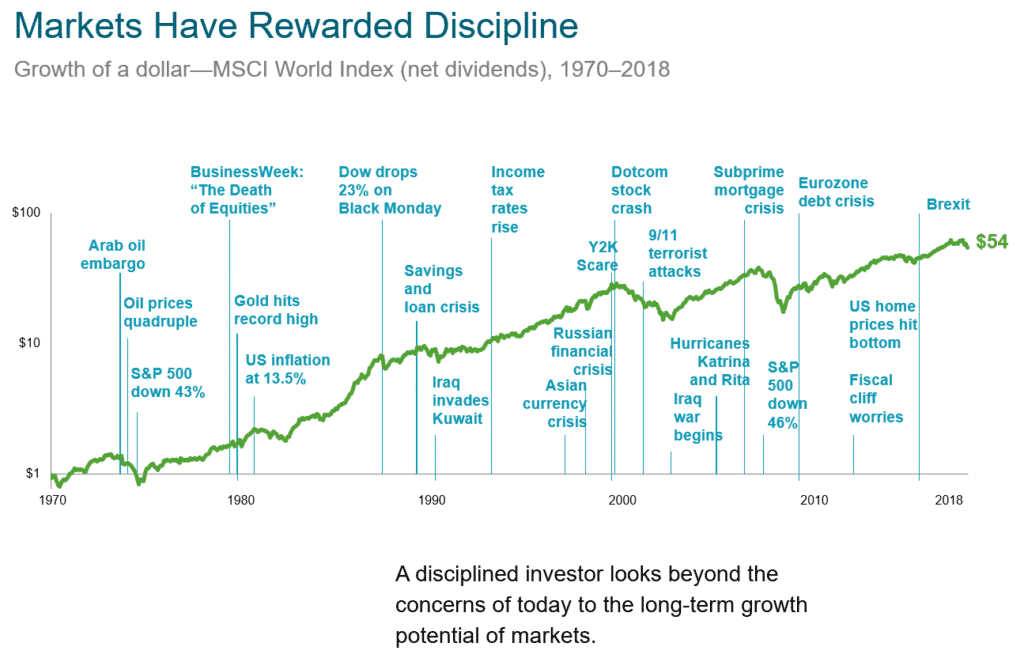

The last chart covered a very long period of time. This is just an example of events over the last 50 years that have caused very significant headlines, and a lot of stock market volatility.
And, there have been a lot of very scary headlines over the last 50 years.
We’ve seen inflation, wars, stock market crashes, terrorist attacks, natural disasters, experts saying all sorts of dumb things…and still over this period, which was a relatively volatile period, $1 invested in the worldwide stock market turned into more than $50.
50 years does sound like a lot, but it is pretty representative of the time an investor is in the market. If you begin saving your first few dollars in your late 20s or early 30s, you will be needing that money when you are retired in your 70s and 80s.
So, the one thing we know is that the next 50 years, and even the next 1 year, will include headlines just as dire as some of these. But we also know that over long term periods, the world economy will bounce back and produce returns for patient investors.
We know that the movement of the stock market is out of our control. But there are things that we should focus on instead, and spend time getting put into place.
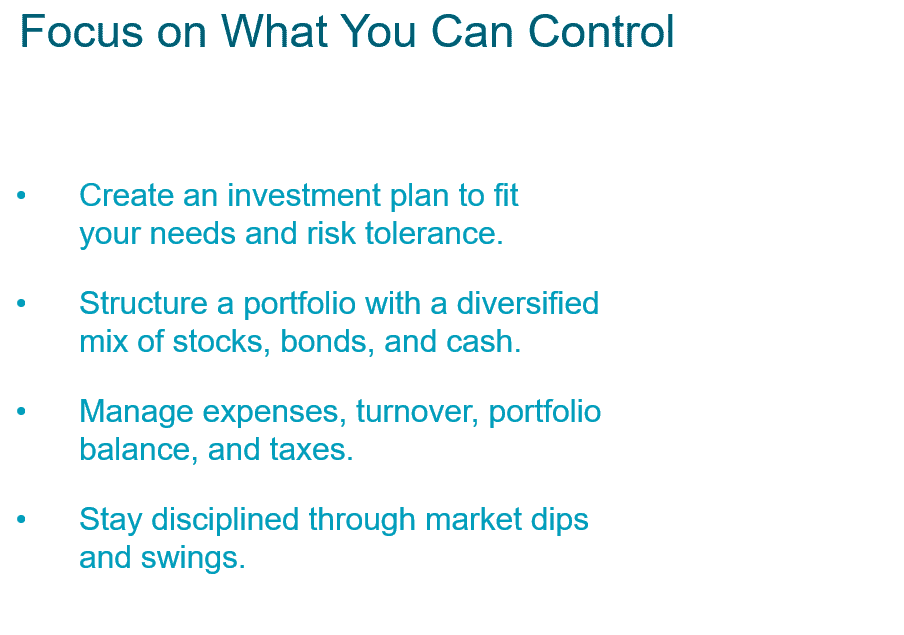

Create an investment plan to fit your needs.
We allocate your portfolios to include a mix of cash, bonds, and stocks.
If you are retired and withdrawing from your portfolio, you know that we keep extra cash set aside to cover your monthly withdrawal for a period of time to protect you from scenarios just like what we are seeing now.
Then, you have a solid portion of bonds as part of your plan. This has provided stability relative to the moves we have seen in the stock market recently. These bonds are primarily US government bonds, with a small portion of investment grade corporate bonds as well.
And lastly even the stock portion of your investments is diversified with holdings from small and large, US, and international companies. We are seeing a time right now when lots of former bellweather stocks are down significantly more than the market. Boeing is down 70%, Oil stocks like Halliburton, Exxon, and BP are down between 50% and 80%. Holding a diversified portfolio of stocks has still gone down, but it has insulated you from the worst of the declines we have seen so far.
We can manage your investing expenses, turnover, portfolio allocation and taxes.
We choose low cost index funds to invest with. This keeps money in your account to grow and compound rather than going to fund managers. We keep your portfolio allocation consistent, and rebalance as the market makes big moves to keep your portfolio in line. And lastly, we can take advantage of periods of volatility like we are seeing today and tax loss harvest, which actually provides a tax deduction for you in years like this one.
And lastly – Stay disciplined through market dips and swings.
All of this is for naught though if we don’t remain disciplined through the tough times in the market. Whether you are 60 or 70% stocks means very little if you sold everything during the depths of 2008 in a panic.
We are here to help you through times like this.
We know there is going to be some terrible headlines coming up, Whether it relates to the number of virus cases, unemployment, company earnings, or economic growth. And we’ll probably see more stock market volatility too. The market is trying to price all of that information in now, but frankly we don’t know what will happen or exactly how long this will go on.
But, know that the market is very forward looking. In 2009, the market bottomed 6 months before economic data like unemployment peaked. So, don’t let the headlines you read in the next couple of months dictate how you invest for the future, because the market has already been adjusting and pricing in the best estimates of that data that we will see over the next couple of months.
Finally – Remember that you have a good investment plan, one that has stood the test of time before. There’s a lot of good news for people that are disciplined investors. And you will want to be in the market when this blows over and the market recovers.

Quinn worked for nineteen years in HR consulting and corporate finance before realizing he wanted a more direct way to help people improve their lives. When he's not working with clients, you’ll probably find him tag-teaming the work of raising two boys with his wife, Brie. If there’s time left over, he'll be catching up on the Netflix queue or reading his way through an ever-growing stack of books. As a flat fee advisor for Arnold and Mote Wealth Management, Quinn is a CFP® Professional and member of NAPFA and XY Planning Network. Arnold & Mote Wealth Management is a flat fee, fiduciary financial planning firm serving individuals and families in Cedar Rapids and surrounding areas.