In this blog post, we will delve into the benefits of investing in low-cost, passively managed index funds. We will explore the academic research on the topic, the underlying principles of investing, and the advantages that investing in index funds provide investors.
Whether you’re an experienced investor or just beginning your retirement saving journey, it’s essential to make informed decisions with your portfolio that align with your long-term goals. Among the thousands of investment options available, one strategy stands out for its simplicity, effectiveness, and cost-efficiency: low-cost, passively managed index funds.
Below is a replay of a webinar we did for clients in June 2023:
Webinar Transcript:
In this webinar, we’re coving 3 main topics of asset allocation.
We’ll start by just looking at what investments you should own. This is diversification.
Once we establish what types of investments we want to own, we’ll look at the many options of how to own them.
Then, finally we’ll look at the impacts of the costs of investing and the effect that can have on your performance.
Why Invest in Low Cost Index Funds?
To start, let’s begin with a basic goal…
We have money we want to save now to grow for the future. We know or we’ve heard that investing in the stock market is a good way to do that.
That’s great, but investing in stocks can mean a lot of things. So where do we start?
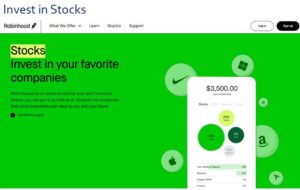
How to Invest – Robinhood
And some googling or following advertisements you see is going to quickly entice you with the prospect of buying individual stocks. Here’s Robinhood’s website – invest in Nike, Tesla, Apple, etc.:
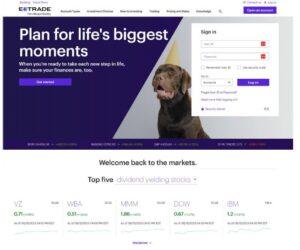
How to Invest – ETrade
And another – ETrade. Right on the homepage is highlighting a few individual stocks. Why would you not want to own these top dividend stocks, right?
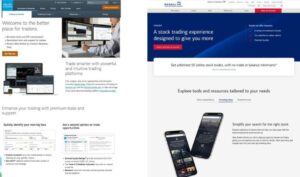
How To Invest – Charles Schwab and Merrill Lynch
Same story with Schwab and Merrill:
“Quickly identify the stocks for you.”
“Simplify your search for the right stock.”
This is how a lot of people get started investing, at least with savings outside of a workplace 401(k) or retirement plan. New investors are definitely pushed to individual stocks and the idea of finding that one right stock is all you need.
Why Invest in Stocks?
I think a lot of the appeal of investing this way also comes because of stories or headlines like these here:
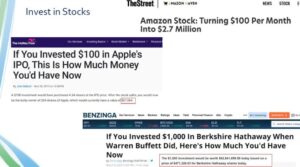
Investing in stocks is really easy, and everyone wants to invest in that one stock that is the next Apple, or the next Amazon, and dreams of hitting it big with your investments.
Is this really the best way to invest? Search and find a few individual stocks and hope you’ve found the next Apple?
And if so, how many stocks should you then buy?
Average Historical Returns of Individual Stocks vs Index Funds
There is a good amount of research on this. And there’s one really interesting research paper on this in particular, with the title “Do Stocks Outperform Treasury Bills?”
It is a very comprehensive study based on 90 years of stock market history and looking back at the performance of more than 25,000 stocks that traded over that time period.
And what they find is that owning a select number of individual stocks more often than not leads to results much worse than what we think of as the average returns of the stock market.
I pulled out a few quotes from the paper to highlight:
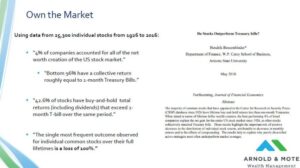
First, 4% of companies accounted for all of the net worth creation of the stock market.
A very select number of stocks are responsible for the returns of the stock market.
Even if you buy individual stocks and own hundreds of them, if you miss just the few that will go on to perform well, your performance will rapidly become similar to the return you would have received if you just bought short term treasury bonds instead. Which are much less risky and volatile by the way.
Going further, less than half of all stocks that existed in the 90 year period had returns greater than a 1-month treasury bill. So if you bought a stock in this time period, it is more likely you get a return lower than a 1-month Treasury Bill than anything close to the general stock market return.
And lastly, the single most frequent outcome for an individual common stock is a loss of 100%. While the stock market as a whole has produced very good returns, the average individual stock does not.
What is the takeaway from this paper? Owning anything less than the entire stock market very quickly puts you at risk of significantly underperforming the general stock market, and taking on a lot of risk for an investment that does no better than a simple risk free Treasury Bill.
Most Individual Stocks are Not Good Investments
And this study is not out there by itself. Here’s a chart from a separate JPM research paper that looks at a data set just since 1980, and of the Russell 3000 index, which is the 3,000 largest public companies in the US. So, a smaller data set than the previous paper, but still very thorough:
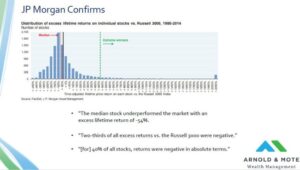
And they find the same general ideas. Here’s a few quotes:
The Median return of an individual stock over this period is 54% less than the general index. In other words, the median stock significantly underperforms the general index, which is propped up by the very few, very rare extreme winners.
66% of individual stocks had returns less than the Russell 3000 index.
40% of stocks had negative absolute returns. So not just underperform an index, but lost money for their investors.
Now, you can look at these 2 research papers and come to the conclusion that if you just picked the best stocks, you could outperform the market. And I guess that’s technically true, but it is sort of like saying you can get rich by playing the lottery or playing slot machines at the casino. You might get lucky, but the numbers say you are much more likely to lose money instead.
We read this data and say – OK, its not worth it to try and pick a few stocks hoping we pick the next Apple or Amazon. We should own as many stocks as we can to have access to the entire market, and make sure we have exposure to those 4% of stocks that are the extreme winners and will give us the returns we want with much more certainty.
Diversification is Best
So we take what we learned from those 2 papers, and now we say we don’t just want to invest in stocks, but we want to invest in a lot of stocks, as much of the market as we can so that we can capture the market returns.
What is the best way to go about doing that then?
Benefit of Mutual Funds
And this is where mutual funds and more recently ETFs come in.
This need for diversification was figured out a long time ago, and the mutual fund was invented.
Here we are looking at a fund by Capital Group, or American Funds that has been around since 1934. You can still buy this today, the fund has been around for 90 years:

What does a mutual fund do? You can see here it is going to make it much easier to invest in a large number of stocks. This fund owns just under 200 stocks.
But this is just one mutual fund – how do you find the best one for you?
Finding the Best Mutual Fund
And this is harder than it might seem. There are more than 7,000 mutual funds available for US investors today – which ironically is more than the number of individual stocks that exist.
So trying to narrow down the investment universe is hard.
If you use Google to help you, you’ll be presented with a lot of ads, expensive services to read their fund ratings.
Searches like this are likely going to bring up results from what are called active funds. These are the exciting investments that are out there that make headlines or are frequently written about because they are led by some star fund manager, or performed very well last year so it received a 5 star rating from somebody. Or the fund company just spends a lot on ads.
Active vs Passive Index Funds
What does an active fund mean exactly, and what’s the alternative to active funds?
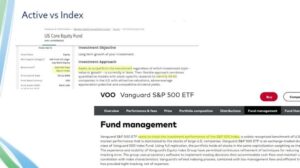
On the left here is the fund description for an active S&P 500 fund. Notice the highlight that they are seeking to outperform the benchmark by using quantitative models and research to just select between 30 and 60 stocks in hopes that they select the best and avoid the worst of the index.
The other end of the spectrum are index funds. An example here is shown on the right, and it is Vanguard’s S&P 500 fund. Notice the difference in the description – seeks to track the performance of the S&P 500.
Vanguard is not trying to pick winners and losers, just simply own all 500 stocks to ensure that the fund gets the return of the market. That is the difference between an index fund and an active fund.
Most Mutual Funds Do Not Provide Diversification
Which one of these funds is right for you? Well we know from our first topic of diversification that we want to own a lot of stocks.
One problem with active funds in general is that they hold only a select number of stocks. According to this paper shown here – The median number of stocks held by an active mutual fund is 65.
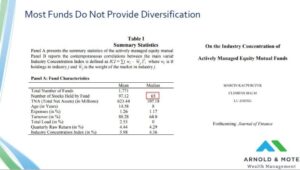
Add this fact to the findings of the first paper we looked at about a very few number of stocks that produce the return of the stock market…. And we can put these two findings together and say that if we hold only a few stocks, we are greatly reducing the likelihood that we own one of those 4% of stocks that will produce those great long term returns.
This is going to make it more likely that these funds then underperform the general market.
SPIVA mutual fund underperformance report
And what do you know, the data shows this.
This is a table from a report by Dow Jones, from an annual study they do each year called the SPIVA or S&P Indices vs Active report. They look at the percent of active funds that underperformed their benchmarks over different time periods.
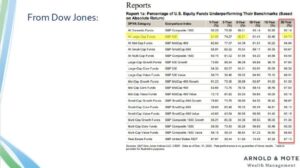
Just for example, since we were talking about the S&P 500 earlier, let’s look at the second row in this table for Large Cap funds that are benchmarked to the S&P 500. In 2022, 51.08% of funds underperformed the S&P 500 index. So about half of the fund managers got lucky, or they would say their skill led them to pick the best stocks I’m sure, and did well and half did poorly. But, over longer time frames, for example 5 years now. 86% of funds are underperforming the benchmark. Over the longest time frame, 20 years now, nearly 95% of funds have underperformed their benchmark.
To say this another way, if you bought an active S&P 500 fund 20 years ago, there is a 95% you underperformed the S&P 500 index.
And so, if you are wanting to invest in a fund today, you have to look at this data and at the very least understand that you are making a bet on a very unlikely event if you are investing in an active fund and expecting it to outperform the general market.
Lastly, you can see that these numbers stand for every index S&P tracks. Whether its small companies, real estate funds, growth funds, value funds. It doesn’t really matter – As shown as you look down the right hand column, the vast majority underperformed their index over the time frames that you and I will be investing over.
Morningstar Confirms Most Funds Underperform
And Dow Jones is not the only ones that found this type of result. This is data from Morningstar that looks at many more indices, not just indices managed by S&P, and also a lot of different types of categories, emerging markets, foreign stocks, bonds and so on.
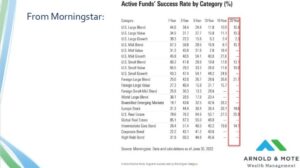
What might be confusing at first glance is that these numbers are now success rates. So for example a 10.4% number in that far right column means that 10.4% of funds outperformed their index. This would be an 89.6% underperform rate if it used Dow Jones method of reporting that we had on the past slide.
Morningstar’s data shows a similar story, the vast majority of funds underperform their benchmarks over longer periods of time. If you really want to invest in an active fund, you have to go into knowing at the very least that the numbers are against you.
Why Index Funds Are Best
We look at all this data, that concentrated stock positions are very likely to underperform an index. And active funds are likely to underperform for the same reason.
That leads us to index funds. Unlike actively managed funds, these are funds that just simply own every stock, or bond, in the index – Not a select amount. So these satisfy our desire to be diversified as possible and own the whole market.
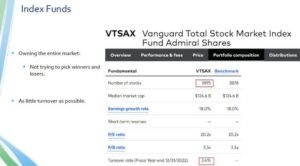
And since these funds are just simply following an index, these funds are not constantly trading, buying and selling all the time. This is where the passive term comes in.
Passive is measured by a fund’s turnover rate which tells us the amount of the funds assets that changed investments. Shown here is a Vanguard fund with a 3.4% turnover rate, which means a very small portion of the fund is different compared to a year ago.
A 100% turnover rate would mean that all investments that the fund had last year are now gone and replaced with new holdings. Active funds tend to have turnover rates of 50% or higher.
So, these passive index funds get you exposure to the whole index, making it much more likely you’ll own one of the 4% of stocks that will do really well, and that your portfolio gets the stock market returns that we are all looking for.
New Investment Philosophy
Now our statement is not just invest in stocks.
Not just invest in a lot of stocks.
But investing in passively managed index stock funds.
There one last level of detail we’re going to add to this, and that’s fees.
Index Fund – Low Cost Matters
Because even if you just select passively managed index funds to invest in, you are still exposing yourself to one other variable that can cost you significantly over time and reduce your investment returns.
Let’s look at these 2 funds as an example. On the left is the Rydex S&P 500 index fund. On the right is Spider’s S&P 500 ETF, this is actually the very first ETF ever launched – just for a fun fact. It is a famous fund, if there is such a thing, so its commonly just referred to as its ticker symbol – SPY
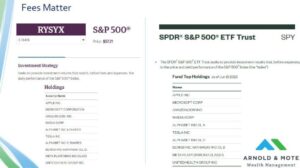
These funds have similar names that would lead you to conclude they are the same. The descriptions of the funds are also just about identical.
And the top holdings of the funds are the exact same as well.
So, is there any reason that one of these funds is better than the other?
Yes, because these funds charge significantly different fees.
S&P 500 Index Funds – Fee Comparison
Fund fees are known as expense ratios, they are always in percentage terms.
You can see here that Rydex charges 2.31%, while SPY charges 0.095%.
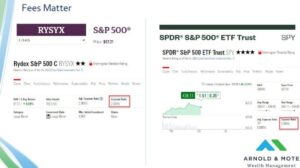
Now, every fund is going to have some kind of fee. And sometimes it might be worth paying a little more for different types of investments. For example,emerging market funds always have a little higher fee because its expensive to manage a portfolio of small companies in non-developed countries.
But when 2 funds are doing the exact same thing, if you see a fee difference like this, run to the lower fee option.
Fee impact 5 Years of High Expense Ratios
Why do I say that? Remember, these funds are investing you in the same thing. If the only difference is the fee, a higher fee will reduce your performance.
Shown here is a performance chart of these 2 funds over the last 5 years. As you would expect the higher fee fund, shown in purple here, trails significantly. Why is that? The 2% higher fee means 2% less return each year.
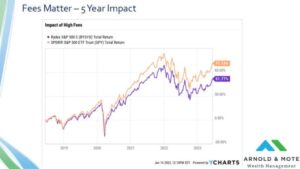
You might expect then that over a 5 year periods you’d see a 10% performance difference, right? 2% times 5 years…. But there is compounding on that fee difference too. That means about a 20% difference in performance over the prior 5 years.
Fee Impact 15+ Years of High Fees
And the performance gap just gets more and more pronounced as we look at longer and longer timeframes. Here’s the same 2 funds, but looking at more than 15 yeas of performance data. Now we are looking at more than 150% difference in total performance.
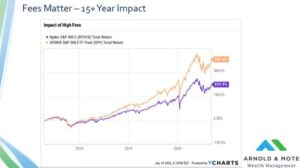
It is really incredible. 2 funds that at first glance should do the exact same thing, have dramatically different returns.
Best Investment Philosophy
That leaves us with this, our core investment philosophy: Invest in low cost, passively managed index stock funds. Get exposure to the market at as low of a cost as possible.
What’s the downside to this strategy?
It’s not exciting. It won’t get a crowd around you at the golf course. So, you’ll have to be OK with your friends thinking you’re boring I guess.
Disadvantages of Index Funds
There is one common criticism about index funds, and that is that index funds “destine you for mediocrity”. Index funds are never going to turn your $1,000 into a million dollars overnight.
But that doesn’t mean they are bad investments. This point I will push back on, because I think it is deceiving.
Remember this chart from earlier, the SPIVA report, on the vast number of funds that lose to their benchmark over time:
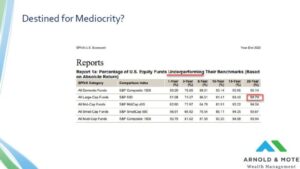
I look at this chart and say, hey, if I could have just received the return of the benchmark over the prior 20-years, I would have outperformed 90% or more of investors.
That is hardly mediocrity…that’s top decile of investors – which pretty darn good!
Average Investor Returns
This is the final slide here, but just one more data point about how investing like this would have historically put you in much better shape than your peers.
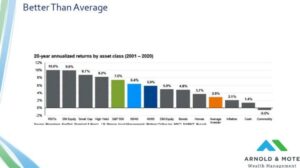
This is a chart from JP Morgan looking at performance of different types of investments over a 20 year period from 2001 to 2020. You see lots of investment classes you are familiar with in grey, real estate, different types of stocks, bonds. Then they also overlay a diversified portfolio of 60% stocks and 40% bonds in blue here, and then the performance of what they call the average investor in orange.
The data comes from Morningstar, they determine the average investor return based on fund flows, if they see a fund get a lot of new assets from new investors and then drop in price, they know the average investor in the fund had losses.
These are annualized return numbers. And you can see according to this data, the average investor had less than half the returns of a basic 60/40 investment portfolio invested in low cost index funds.
And think about this time period, it contains many significant events that you may think would reward those savvy investors picking stocks. Several periods of very volatile markets. 2001 has the tech bubble bursting. 2008-2009 of course, and it ends with the Covid crisis.
And as you can see, sticking to the boring index portfolios over this 20-year period would have put you well, well ahead of the average investors. Not mediocre at all.

Matt Hylland is a financial planner and partner at Arnold & Mote Wealth Management, where he helps individuals and families make informed decisions around retirement planning, investment management, tax planning, and comprehensive financial strategy. As a flat-fee, fiduciary advisor, Matt focuses on providing objective guidance designed around each client’s goals and long-term financial needs.
Before transitioning into financial planning, Matt worked as a materials scientist for the Department of Defense, bringing a problem-solving mindset and analytical approach to his work with clients. He has been featured or quoted in nationally recognized financial publications, including The Wall Street Journal, CNBC, and Kiplinger, for his insights on personal finance and investing.
Years of experience: 10
Specializations: retirement decisions, tax-efficient strategies, investment choices, and the complex financial decisions that come with major life transitions.