
History has shown that stock market declines are a normal part of investing. But how do we know when a stock market decline is more mild and of little concern to your long term financial plan, or something extraordinary that requires adjustments to your retirement plan?
This post has a replay of a webinar we did for clients in July 2022. We discussed how we determine sustainable spending amounts in retirement, how we monitor the health of a financial plan over time, and how we determine when changes to withdrawals or asset allocation need to be made in response to stock market volatility.
Main points discussed:
- A basic discussion of monte carlo analysis. What does “probability of success” of a financial plan really mean?
- How we use “guardrails” to determine when a plan needs adjustments
- How we calculate how big changes need to be
Below is a video replay and transcript:
How To Create a Plan For Retirement in Excel
How do we come to the conclusion with a client that their financial plan is a good one?
One of the most simple ways to create a retirement plan would be to just go into excel, enter your account balance, factor in savings while working and spending or withdrawals that are needed in retirement, and apply a growth rate on your investments.
For example, if we have a 55 year old couple who plan to retire at 65, and just assume a 6% growth rate every year on their retirement account savings – If you graphed the balance of their retirement account over time it would look something like this:
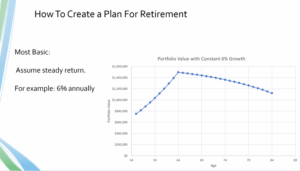
While simple, this type of analysis can be valuable. If it shows your account balance going to $0 if 10 years, its probably a good sign that you should reconsider some elements of the plan.
Likewise if you just see assets increasing exponentially, its probably a good sign the plan is strong or even that you are significantly underspending.
But, Sequence of Returns Matter
Where this type of simple planning fails is that the average growth rate assumption is not really realistic. While a 6% average annual growth rate might be safe to assume and historically accurate. The market doesn’t really tend to work that way.
And while a long term return over your life might end up averaging something like 6%, its pretty rare that the market actually returns 6% in a given year. And we see this in times like the last few years where the market might be up or down 20% or more in a single year.
In the long run your returns might average out to 6%, but at the time it doesn’t feel like very average times!
And when you consider the variations in returns that produce that long term 6% average return, things start to look very different.
I added a few more lines on the chart here that show potential portfolio values over time for annual returns that still average 6%, but you can see that your retirement can look very different depending on how those returns of any single year fall.
This is called “Sequence of Return Risk”. Average returns may be important, but what is actually MORE important is how those returns fall.
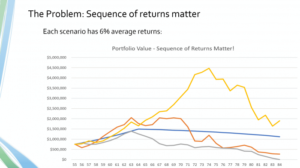
You can imagine the investor who has a retirement that follows this yellow line here, where they have a period of strong returns in the late 60s, and then poor returns much later in life, has a very different retirement experience than the grey investor, who has poor returns early on and then very good returns later.
So this was just an example of a few different scenarios. Doing much more than that gets pretty hard in Excel.
But with the power of computers we can do this many, many times.
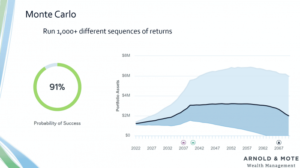
Monte Carlo Retirement Analysis
And that type of simulation, running thousands of scenarios, is called monte carlo analysis.
Monte Carlo is great at giving us an idea of the range of possible outcomes for a scenario that can have a lot of variation in the inputs…just like annual stock market returns!
This type of analysis is nothing new or groundbreaking. In fact it is much more established in uses outside of the finance industry.
The modern version of using computers to run monte carlo analysis was originally developed in World War 2 for the Manhattan Project to help predict reactions between neutrons and fission material for making the first nuclear bomb.
While physicists knew the half life of elements like uranium, (An element’s half life is how often on average an atom decayed and emitted neutrons that can create a nuclear reaction), in reality there’s no way of knowing exactly when a specific individual atom will decay.
So, the physicists at Los Alamos needed to know how much material they needed to have in a bomb that created a high likelihood of creating an atomic blast, instead of just a dud.
Applying Monte Carlo Analysis to a Retirement Plan
I gave that example because I think believe it or not it relates very closely to the stock market. We have 200 years of history for the US market, and 600+ years of international stock market returns. We can be pretty confident that over really long time periods investors will get a certain average return – Just like physics can be very certain that the half life of Plutonium-239 is 24,100 years on average.
But, just like the physicists that can’t predict exactly when an individual atom will undergo nuclear decay, we have no way of predicting a single year’s return for the stock market.
So, we run a simulation enough times to give us a degree of confidence that what we are doing will get is there a vast majority of the time. We don’t want to just make sure you have enough to retire in one specific scenario, or that the bomb might go off if everything falls just right. We want to make sure that 90% of the time, or some range of probability you are comfortable with, we get the desired outcome.
And this chart in the image below shows you an example of an output of a monte carlo simulation for a retirement portfolio. You can see an average type of return with the dark blue line, but then a region of possible outcomes that are statistically possible.
How Does Monte Carlo Analysis Work?
How do we know that our 1,000 scenarios in a monte carlo analysis are realistic in the first place. After all, we are putting a lot of confidence in these projections. We’re using this to tell you to feel confident to keep spending even in a year like this one.
The trials based on long term data of returns, and also the standard deviation of those returns over time. You can think of standard deviation as the volatility in the market.
Every investment in your portfolio has these values. But just for example, US stocks have a long term average annual return of just over 10%. We also can calculate the variability of that return. We know its not 10.1% every year, and we know the statistical range of historic outcomes.
Standard Deviation
And with that historical data, we can assign probabilities of certain returns happening.
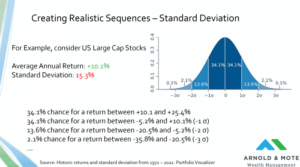
I won’t go into details here, but with assuming that stock market returns fall in a normal distribution that’s that bell curve shape, this historical data gives us realistic inputs to have the monte carlo simulation run.
And again just using US large cap stocks as an example, with their historical volatility we plug in these percentage probabilities of different returns.
So for our 1,000 trials, 136, or 13.6% are going to include a return between -20.5% and -5.2%.
21 of those trials, or 2.1% will have a decline between 20.5% and 35.8%.
And so on. Now we are sure that our 1,000 trials are really based on realistic probable outcomes.
Chart of Historic Stock Market Returns
And just to bring this back to reality, this is what we see when we look at those 200 years of US stock market returns.
This is just a plot of annual stock market returns. Each yellow brick is for a single year, and the bricks are grouped with other years that had similar annual returns.
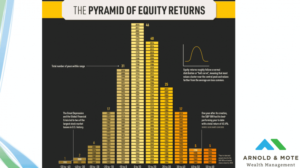
For example the year 2015 had a return between 0 and 10%, so it goes in the middle column.
And we see that on average, its much more likely we get an annual return in that 1 standard deviation range, in the middle here, compared to a 2 or 3 standard deviation move, something like + or – 40%.
Really, just a different way of showing us what that last slide did as well.
Probability of Success in Monte Carlo
And so that calculation gets run for every investment in your portfolio. Emerging market stocks with high volatility, bonds with lower volatility, and everything else and we end up with it all coming together to create this output:
And so the first thing we like to point out to people worried about these short term moves in the stock market is that moves like we see today are in our underlying assumptions. Today’s volatility is not something out of the blue that we were never counting on happening.
In fact, we know for sure they will happen some time in your retirement.
So with all of that, we give you a snapshot, with today’s values there is a 91% chance that you could get through retirement without ever needing to cut a dime from your planned spending.
But what does a 91% probability of success really mean?
Probability That Your Plan Needs Adjustment
But, while the monte carlo is just a snapshot, we know that really financial planning is dynamic. We can make changes. Your future spending is not carved in stone and required that you follow it to a T. You are not on a set course that 9% of the time leads you to living on your kids couch in retirement.
Because of that, a lot of people rephrase the term probability of success into probability of adjustment. Because in reality we would not just sit idle and watch your portfolio go to 0.
9% of the time, We would have to recommend changing spending to keep your plan successful.
Even that is a little easier said than done though. Because we don’t know if today’s decline is one of the 9% of times.

So we try and be proactive, instead of waiting and just letting your portfolio fall to 0, we can recommend small changes now.
What this means is that more than 9% of the time we might be recommending adjustments to your spending to be really conservative that we are keeping you out of those 9% of scenarios.
Retirement Guardrails
What this looks like is something like this:
As your portfolio goes up and down, the monte carlo changes slightly. If you have $2 million today it might be 95%, if the market drops and it goes down to $1.2 million, it might be 70%.
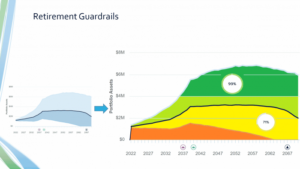
While that one monte carlo was just a snapshot, we keep running it over time. As the market continues to fall or rise we can recommend really small changes to spending that gets you out of potential scenarios that have a higher chance of spending down the portfolio
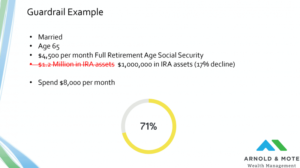
Example of Spending Adjustments Needed in a Retirement Plan
I thought it would be good to give a real life example here, because a lot of times the changes that need to be made are much smaller than people worry about, even if we get a historic decline like we see today.
For example, consider this hypothetical client:

They have the 91% probability we have been looking at.
Spending Adjustments Needed if Stock Market Declines
But now, the market really declines just as they are retiring and their 60/40 portfolio goes down about 17%, this is a little worse than the decline we are seeing today, just to put it in perspective.
Now, we are monitoring the monte carlo, and we see it is starting to get in a range where we think it would be prudent to recommend a change.
Finding a New Sustainable Spending Amount in Retirement
And we can help here by finding a new spending amount for the time being that brings that probability up, or in other words helps protect the portfolio while its down and help make it more likely to avoid being in one of those 9% of scenarios where originally the portfolio was going to be spent down.
And again, this is real numbers here. If this client who is spending $96,000 per year would cut spending by $300 per month, it can have a very significant impact on their plan.

I wanted to show this because I think we find a lot of people worry that they’d need to cut thousands and thousands of dollars per month in spending at a time like this, and that’s just usually not the case.
Upper Monte Carlo Guardrail
By the way, this works both ways too.
Of course today we are worried about the impact on your retirement plan from the decline in the market. But there is also a risk that you dramatically underspend during retirement.
And monte carlo analysis can be good for this scenario too.
For example, what if this hypothetical client’s assets increased in value. How much could they afford to spend then?

Summary
Planning is dynamic. Monte carlo is a snapshot, and very useful on its own. But putting too much faith in a reading of 99%, or 50% for that matter today, when your plan changes every day is not the right thing to do.
This is why we’ll reach out to meet with you this fall, and next spring for meetings, so that you can be comfortable about your plan. We are staying on top of this, and by doing so and if applicable making small changes today can do a lot to make sure your plan stays on track.
We also like to point out that monte carlo on its own adds conservative element to your plan. Unlike that basic excel spreadsheet model we started with, it assumes these types of declines will occur.
And then it assumes they may happen again even from today’s depressed levels. I think this is a good conservative assumption to make, but historically if the market has dropped 20%, it doesn’t fall 20% right away again, but monte carlo will assume it is possible and reflect that.
If you get anything out of this, we hope seeing a real example helps in knowing the magnitude of changes that can be made to have a big impact.

Matt worked for the Department of Defense as a material scientist before changing careers to follow his interests in personal finance and investing. Matt has been quoted in The Wall Street Journal, CNBC, Kiplinger, and other nationally recognized finance publications as a flat fee advisor for Arnold and Mote Wealth Management, a flat fee, fiduciary financial planning firm serving individuals and families in Cedar Rapids and surrounding areas. He lives in North Liberty, where you will likely find him, his wife Jessica, and two kids walking their dog on a nice day. In his free time Matt is an avid reader, and is probably planning his next family vacation.