
Today’s environment of rising interest rates and inflation has made for a very volatile period for your bond investments.
What has typically been the safe, boring part of your retirement portfolio has now been subject to volatility not seen in many decades. In this webinar, done live on March 25th, 2022 we discussed why bonds perform poorly during rising interest rates, what types of fixed income investing is most protected from inflation, and how this decline compares to previous times of inflation and rising rates.
Current Headlines – What’s Going on in the Bond Market?
This is an example of headlines that has been in the news recently:
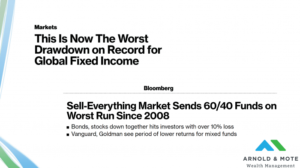
“The worst drawdown in history.”
“Sell everything”
While these headlines are technically correct, I think it is important to put this in context –
Bond Market Chart
This is what the chart of this historic decline looks like:

This is a chart of the performance of the general bond market over the last 20 years. The recent historic decline is this drop at the far right side.
Which if you just look at the chart, paints a much less dramatic picture than the headlines. The value of a broad global bond index has still more than doubled in 20 years, not bad for what is the safe and conservative part of your portfolio. And, we are simply back to where we were 2 years ago. While not great, perhaps not as dire as those headlines might leave you thinking.
So, this is a good example of being careful getting really excited by sensational headlines like we are seeing today.
Not to make light of what is a decline in the value of our investments, But I think important to put these scary headlines in perspective.
What makes this period just feel a little different, and why we’re doing this webinar, is that this volatility recently has been in what has historically been the very stable part of your investment portfolio.
The headlines are right technically, this is a large drawdown relative to the bond market history. But this is nothing like a historic drop in the stock market would be.
If just the general stock market was down 10%, that is something we are used to a little more It happens nearly every year on average historically.
But this volatility is primarily occurring in that part of your portfolios that have not seen it recently. So it is worth spending some time looking at why this is happening and what it means longer term.
Risk for Fixed Income Investments
To start, what are the primary risks for bonds?
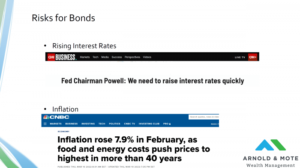
Since bonds are fixed payments over certain periods of time, it is easy to see why today’s environment is not necessarily so great for bonds.
Rising interest rates mean that new bonds being sold today have higher interest rates, so bonds previously purchased with lower interest rates become less valuable.
Of course inflation is bad for fixed income because that interest payment you get every year from a bond loses purchasing power each year.
And, its not a surprise to anyone that these 2 things are happening today.
Why Do Bonds Decline When Interest Rates Rise?
Just to give a specific example of how this works and the impact it is expected to have. Here is a very general example:

Just to make the math easy, lets assume you buy a $100 bond that pays a $5 per year interest payment. Or said another way, the bond has a 5% yield.
So lets say you purchased that 5% bond last year, and then this year interest rates rise and all new bonds are being issued with a 6% yield.
What happens to your old 5% bond? Well, no one is going to buy a 5% yield for full price, when they could get 6% for the same price.
So if you want to sell this bond before it matures, and that’s an important point I’ll get to in a sec, if you have to sell this bond right now you will have to be willing to accept a lower price. In this case, a price that makes its $5 payment equal to a 6% yield.
Now this math is a bit extreme because it is assuming a perpetual bond, or one that just pays forever. In reality though the math is a little more complicated because it also depends on how long term of a bond you have. Or when the bond matures.
Calculating the Return of your Bond
Because remember how bonds work is that you get principal back once the bond matures. For this example, you gave a company or a government $100. They pay you $5 per year and then once the bond matures you get your full $100 back.
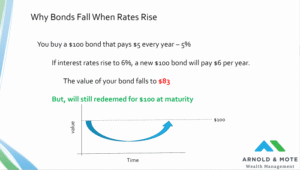
So for this example, the investor that holds this now $83 bond is looking at that saying, “ouch, a 17% decline in value!”. But, if they hold the bond to maturity they will get their $100 back, so that loss they are seeing is only a paper loss as some would say, and would not actually be realized if they held the bond until it matures.
And so the price chart of this bond might look something like this chart here. It started at $100 when it was originally purchased, has fallen in value now, and then as it gets closer to its maturity will steadily increase in value back to its par value, or $100 in this example.
While it is true that other bond holders might be getting more interest, the cost here for this bond holder if they don’t sell is receiving less in the future from interest payments rather than losing principal. Investors who hold these bonds for the long term will see a recovery in the value of their bond investments.
All this is a bit generalized, because you don’t just own a single bond that performs like this, you own bond funds that are made up of many thousands of individual bonds.
Those thousands of bonds have different maturities and bonds of different maturities behave very differently. Very long term bonds in particular are much more sensitive to rising interest rates or inflation and will experience a drop in value like is shown here. Short term bonds, or bonds that are close to be matured, will have very little sensitivity to interest rates because they are close to being redeemed, so won’t see anything near this type of a decline.
Bond Market Performance
The best way to show that is to look at how different types of bonds have been trading over the last year:

This is a chart showing 5 very different types of bonds or bond funds and how they have performed over the last year.
As I said in the last slide, short term bonds, shown in yellow in this chart, have much less sensitivity to rising interest rates, because they mature soon. Investors are not worried about rising interest rates nearly as much because they are not locked in to a longer term bond. So far this year they have fallen about 3%.
But you can see long term bonds, shown in the blue line here, are down much more significantly. Technically this line is a bond fund that owns bonds 20 year or more in maturity, so very long term and you can see here, much more sensitive to rising rates and inflation. These are down nearly 15% over the last year.
For our clients, we use a mix of total bonds, the purple line here, which is just a bond fund term used to say a diversified mix of everything, and also short term bonds just depending on your risk tolerance, cash needs, and so on.
I think its worth noting that some investors really started taking big risks in their bond investments over the last few years when interest rates were really low. Long term treasuries were very popular because they offered higher interest rates. But, now they are realizing the tradeoff in that bet, and that was much more exposure to rising interest rates and inflation and some pretty big declines now.
I didn’t include some other more notable examples on this chart, for an example, some leveraged bond funds were popular over the last few years as well because they could get a 4 or 5% interest rate, and in general those are down 25 to 30%.
As one final example, there was a lot of press about 5 years ago when Austria sold a 100 year bond. A lot of investors flocked to it because it offered a relatively high interest rate that seemed great when other interest rates were so low. That is down more than 50% now. If that investor has to sell that bond in less than 100-years, which seems likely, they will have to sell at a step discount.
So you have heard us say many times that we prefer not to take risk in the bond portion of your portfolio, and that is precisely why. While a 3 to 9% decline like we are seeing in our holdings is certainly not great by any means, people who were undisciplined and reached for yield are paying a much steeper price now.
When Stocks and Bonds Decline at the Same Time
As I said before, what makes this decline in bonds feel a little worse is that it is happening at the same time as a decline in stocks.
Now, you have probably heard us talk about bonds for their diversification. Typically, when stocks have declined bonds have done well. That is not happening now, and it is a pretty rare occurrence, but not unprecedented:
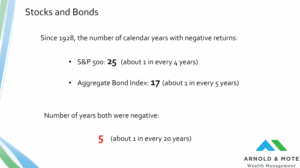
Just for fun, I thought I’d show some numbers on how often this happens. Historically the stock market declines once every 4 years. Since 1928 the S&P 500 has had negative returns 25 times.
Bonds decline a little less frequently, but worth noting that it still is somewhat frequent, about one in every 5 years historically.
But what is more unique are years where both stocks, and bonds are down. In the past nearly 100 years, that has happened just 5 times. So, not unprecedented, but not something we see often for sure.
Historic Performance of Stock and Bond Declines
And here are those 5 times, 1931, 1937, 1974, 1969 and 2018.

And then I looked at the performance of a portfolio that is made up of 60% stocks and 40% bonds. I just used a 60/40 example here just because that tends to be a very common breakdown for retirees.
You can see where we stand today so far, about -10%. Of course the year is far from over, but if it ended today we’d be right in the middle for typical performance in this type of scenario.
So, again, not great to see. But we all know that short term declines are something we will always experience when investing.
5-Year Returns After Stocks and Bonds Both Decline
What is more important to focus on is long term returns. Even if we just look out 5 years from those periods in history where both stocks and bonds declined in the same year, we can see that not panicking was the right decision in all of these instances previously.
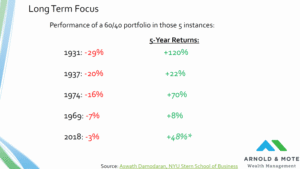
There have been periods of negative 5 year returns historically, but none have come after a year when both stocks and bonds declined.
So, I just wanted to include some of this data because the headlines today paint such a dire picture, but in fact this has never really been a sign of bad things ahead.
10-Year Returns
If we look out even longer – 10 years:

10 years might seem like a long time, but this is the type of time period we need to think about when investing. 10-years after the declines we are seeing now, performance has been pretty good – In fact, a little higher than average!
Investing Despite the News Headlines
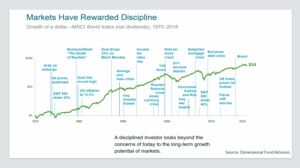
Obviously we don’t know what the next 5 or 10 years will hold for us. But we do know that long term thinking and disciplined has always rewarded investors. I really like this chart from DFA that overlays a general stock market performance with all the scary headlines and events over the past 50 years. It is a few years old now, but $1 invested in a diversified index of stocks in 1970 has turned to more than $50 today, despite everything we have been through.
What I really liked about this is the headlines here that seem to match what we are experiencing, or at least what people are concerned about potentially experiencing now. Increases in the price of oil, double digit inflation, wars, and countries defaulting on their debt.
This chart is a bit off topic since we are primarily discussing bonds today, but the same principal applies to your bond investments and portfolio as a whole too.
Bond Market Performance During Prior Inflation and Rising Rates
Remember that chart from one of our first slides:
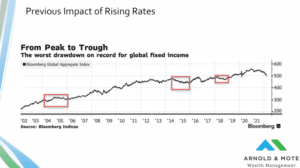
This is a chart of the performance of the bond market. This is not a 50 year chart like before, just 20-years here, but still represents a lot of history for a bond investor.
I highlighted in it periods of rapid rises in interest rates, what I hope is obvious is that with a long term view, these events seem relatively minor even though what happened in these periods in red is pretty close to what we are so worried about today.
In 2004-2005 we saw the Federal reserve raise interest rates 17 times in total, a rise from 1% to 5.25%. Inflation was also around 7% at this time, within a percent of what we are experiencing right now.
More recently, around 2015 and 2016 there were 9 interest rate hikes in less than 2 years. And actually around this time your bonds had one of their worst years in modern history, falling 6%. But, I don’t think anyone really thinks about this time period as notable for being a terrible time to invest.
If you are able to zoom out and look at a period longer than just a year or two, hopefully you realize that periods like this are not as significant as they seem when you are living through them. In the long term, investors have always been rewarded by not making drastic changes to their investments or their financial plan.
Are Rising Rates Good?
To end with a little optimism, I just thought it would be good to think about the positives in rising interest rates.
Shown here is the chart of the yield on a 5-year treasury bond:
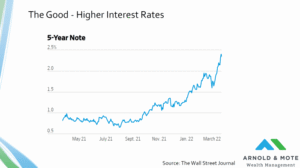
The yield for a 5-year treasury bond has quadrupled, almost quintupled just over the last 9 months or so.
For someone who is looking to be able to get some kind of real interest from a risk free investment like a US treasury bond, I think this is great right. No one liked getting 0.5% on their bonds, and we are getting back to hopefully a more normal time when an investor can expect some type of income from their bonds.
And this is great for as we think about sustainable withdrawal rates for retirees. You might have heard about rules like the 4% rule for example, which is just based off of some research that historically you have been able to withdrawal 4% of your portfolio each year even in periods of long term stock market declines, and not run out of money.
And so, if we can start getting some amount of interest from bonds, you know 2.5% as shown here, that really helps if we think about targeting a withdrawal of 4% of your portfolio. It takes some of the pressure off of needing really strong returns from the stock market every year.
So, in the long run I don’t think an increase back to more normal levels of interest rates should be considered a bad thing, I think we are all looking forward to some level of higher interest rates for our savings and investments.

Matt Hylland is a financial planner and partner at Arnold & Mote Wealth Management, where he helps individuals and families make informed decisions around retirement planning, investment management, tax planning, and comprehensive financial strategy. As a flat-fee, fiduciary advisor, Matt focuses on providing objective guidance designed around each client’s goals and long-term financial needs.
Before transitioning into financial planning, Matt worked as a materials scientist for the Department of Defense, bringing a problem-solving mindset and analytical approach to his work with clients. He has been featured or quoted in nationally recognized financial publications, including The Wall Street Journal, CNBC, and Kiplinger, for his insights on personal finance and investing.
Years of experience: 10
Specializations: retirement decisions, tax-efficient strategies, investment choices, and the complex financial decisions that come with major life transitions.