Let's Get Started
You'll get the most value from financial planning if your specific goals and needs match a firm's philosophy and services. Let's learn more about each other.
Ready to Get Started?


Our goal is to always make sure you know and understand what we are doing in your investment portfolios. Whether it is simply the selection of different investments, or something a little more complex like portfolio rebalancing, we want you to know what we are doing, and be comfortable with how we manage your investments.
For those of you managing your investments yourself, here’s a look at some of the research behind rebalancing, and how we go about doing this for our clients.
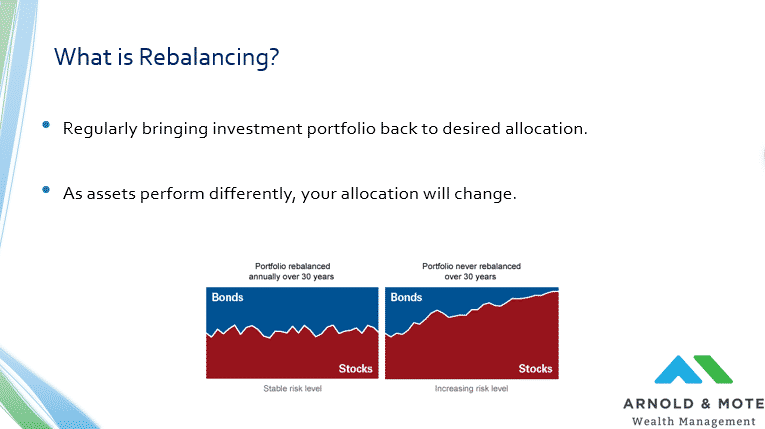
First, to start – What do we mean by rebalancing exactly?
Rebalancing is simply bringing your portfolio back to its desired allocation. If we set you up in a 60/40 portfolio, or a portfolio made up of 60% stocks and 40% bonds, that allocation may not stay exactly 60/40 for very long as the market moves up and down.
Historically over the long term stocks have outperformed bonds, so over time your allocation would slowly drift to become much heavier in stocks than 60%.
Small variations in the 60/40 allocation might not be a big deal, but over longer periods of time, an investment portfolio may become significantly out of balance.
This image here is from Vanguard, showing the impact on a portfolio with rebalancing, compared to those without. On the left is a mix of stocks and bonds that periodically gets rebalanced. As it becomes too heavily tilted towards stocks, stock are sold and bonds are purchased. Likewise, if the stock market has declined significantly, bonds will be sold and stocks purchased.
And the idea is just this, to keep your portfolio balanced around that 60/40 allocation.
For the image on the right, Vanguard uses use monte carlo simulations, the same type of analysis we use for projecting the likelihood of success for your long term financial plan, but here Vanguard is showing how an allocation may likely drift without rebalancing.
And of course we don’t know exactly what will happen over the next 30 years, but just based on average historical stock market performance and volatility, a 40% bond allocation would almost completely be replaced with stock allocation over a 30-year period.
And what this has the potential to set up is someone who creates their retirement portfolio at say age 60, could then find themselves in a very aggressive portfolio later in life, precisely when we see a lot of clients not wanting to take a ton of risk. An 85 year old with almost entirely stocks in their portfolio would be pretty unusual and not recommended for most. But that is precisely what would happen without rebalancing.
Before we get any further we wanted to define one term that we will use several times over the next few slides.
The idea behind rebalancing is pretty simple. Just make trades to get the portfolio back to its desired allocation. But the other decision to make is when to actually rebalance. We saw from the slide before that never rebalancing is likely a bad choice. But, doing it really often, say every day would probably be over kill and unnecessary.
There are 2 primary strategies, either time based rebalancing or tolerance based rebalancing.
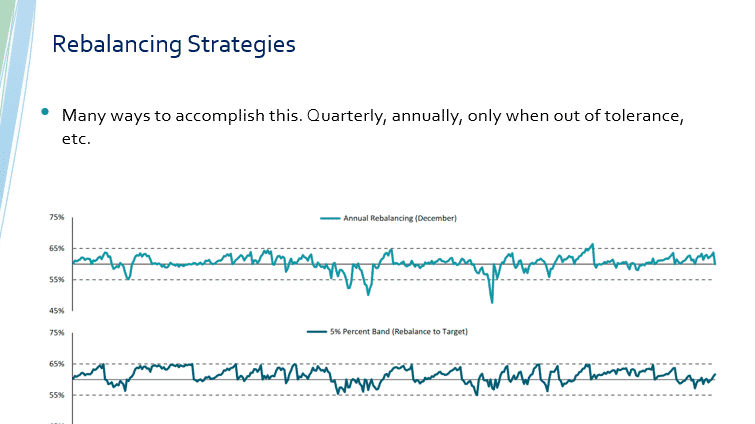
Time based just means rebalancing at a set period of time. You might rebalance your portfolio December 1st of every year for example. This would be annual called rebalancing. Or, You might do it more often, say quarterly. But the idea is the same, set trades every so often.
That is shown in the top half of the chart here. The Y-Axis is the stock allocation, which is originally set at 60%. The as market goes up and down that will change. With time based rebalancing the portfolio may get very out of balanced. You can see in the chart there are times when the allocation dipped to around 50%, and this would only be corrected at certain times, say every December.
The other method is rebalancing only when your portfolio becomes unbalanced by a certain degree. You might say once an allocation is off by 5% or more. So, if you are in a 60/40 portfolio, rebalance when the stock allocation gets to 65% or 55%.
That is shown here in the bottom half of this chart. There is no set, schedule time to rebalance, but it is done only when a certain level is reached.
You will see this strategy referenced as a 5% band or 5% tolerance band in the next few slides.
We will get into exactly what we do later on. But first, let’s look at the real world impact of rebalancing and how it can impact your portfolio.
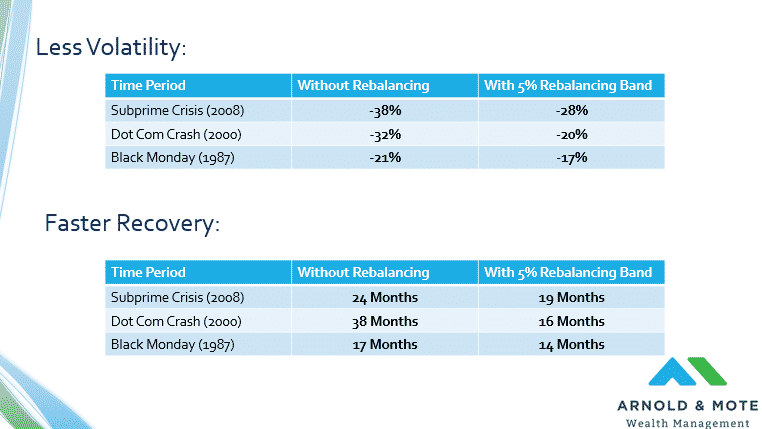
Here are 2 tables that show the impact of a portfolio that is not regularly rebalanced compared to one that has regularly been rebalanced whenever it was 5% out of alignment or more. This is that 5% tolerance band that we just talked about.
The top table looks at the difference in how a 60/40 portfolio performed during a few stressful periods in the past. And this shows one key reason we want to rebalance somewhat regularly. When a portfolio’s allocation drifts to a higher allocation of stocks, it will become more volatile.
For example, a 60/40 portfolio that had gone a couple decades without being rebalanced would have lost 38% in the 2008 crisis. Proper rebalancing using a 5% tolerance band would have reduced that decline to 28%.
And while none of these results are exactly good, rebalancing is not going to prevent your portfolio from declining in a bad market, a 10% or 12% less of a decline can mean $100,000 difference in a million dollar portfolio. That’s a pretty significant difference for you to experience.
The second table looks at recovery time, or the time it takes your portfolio to recovery to its previous high value from the market trough.
And what this shows is that rebalancing helps your portfolio recover faster.
That is because when the stock market declines like we saw during these 3 times, rebalancing means buying stocks. By buying stocks when they sell off, when they are low, you then are able to better able to capture the gains when the stock market finally recovers.
Impact of Rebalancing (Chart)
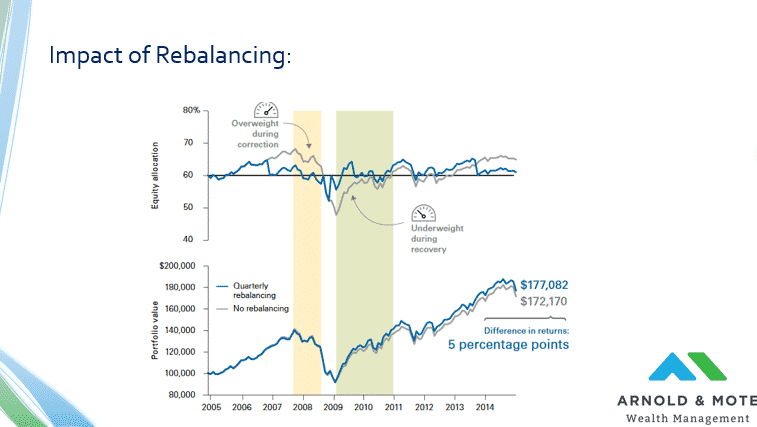
Perhaps a different way to show why recovery times are much faster for a rebalanced portfolio is this chart, which comes from Vanguard.
The top half of this chart shows the asset allocation drift of a portfolio that is not rebalanced, which is the grey line here, and a portfolio that is rebalanced, in blue.
The Y-Axis in this chart is the portfolio’s allocation to stocks. So, as the market rises, the stock allocation drifts higher. But, notice that the blue line then drops back down to the desired allocation periodically as the portfolio is rebalanced.
This is looking specifically at the 2008 crisis. Notice that during 2007 the non-rebalanced portfolio’s allocation to stocks drifts higher and higher as the market rose, eventually topping out near 70%. When the crisis hit, that 70% allocation fell to nearly 50%.
Notice the rebalanced portfolio had a lower allocation to stocks at the market peak in 2007. Also a higher allocation to stocks during the market lows in late 2008 and early 2009.
So, an investor who rebalanced their portfolio did not own as much in stocks right before the decline, and was regularly buying stocks at a low price. This helped the portfolio fall less and recover sooner because they owned more stocks when the market finally recovered.
The bottom half of this image shows the growth of a $100,000 investment for those interested. We don’t view rebalancing as a way to get outsized returns, but instead as a way to control risk.
Vanguard picks this timeframe as an example of when rebalancing helps to add value, and they are certainly right. But rebalancing could also reduce performance during long bull markets since you would be periodically selling stocks as they rise in value.
So, we would say don’t think of rebalancing as a way to get higher returns, think of it instead as a way to ensure your portfolio performs as intended and that you are not taking more risk than you need to.
A few considerations on rebalancing that worth noting.
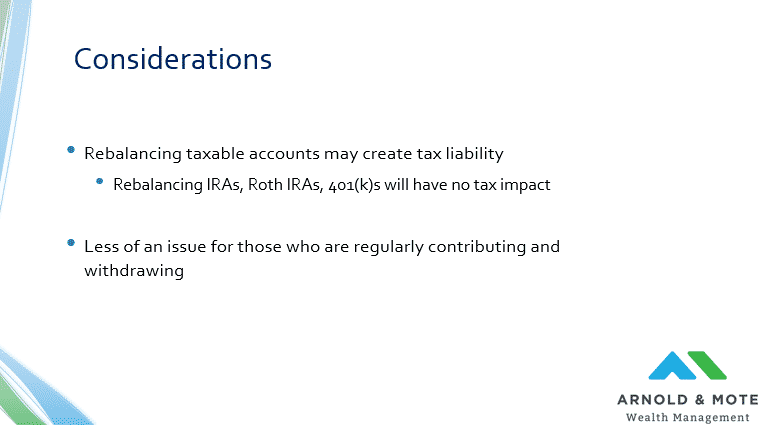
First, doing this in taxable accounts, accounts like your joint Schwab or Schwab One accounts, is still important, but there may be taxes generated from doing so. Rebalancing in a taxable brokerage account may take a little more planning to ensure you are limiting your tax liability and not recognizing short term capital gains. These gains could impact your bigger tax picture, Medicare premiums, Social Security tax rate, or anything else.
This is not an issue for IRAs, Roth IRAs, and 401(k)s. In these accounts you can buy and sell with no concern for taxes. IRAs and 401(k)s are only taxed when you actually make a withdrawal from the account, but trading one security for another does not cause any taxes.
For the last bullet point here, rebalancing is a bigger issue typically for our retired clients more so than younger clients who are still actively saving.
When you are continuously saving into an account, those regular contributions can help rebalance simply by buying more of the investment that you are underweight it. Typically, younger clients who are saving do not have to do a lot of selling to rebalance.
As your account value grows this may change. Eventually regular contributions may not make up for big moves in the market. But in general clients who are still actively saving may see this less than our retired clients, where rebalancing becomes a bigger issue and something you will see more often.
One other consideration here. Our examples so far have been a bit simplified just thinking about stocks or bonds as just 2 pieces. Remember that Vanguard chart one the first slide just showed red for stocks and blue for bonds.
But in reality, your stock allocation is made up of many different investments, there is small cap, large cap, value, international, and emerging markets. Each of these types of investments will perform differently.
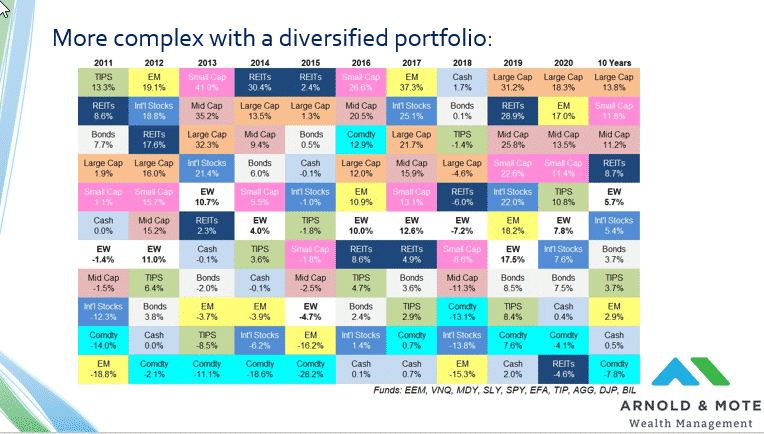
This chart here, sometimes called an asset quilt, is one of our favorites for showing how the performance of these many different asset classes differ year over year, and the value of diversification. Each column represents one year, each asset class has a different color square that has its annual performance noted.
Rebalancing means keeping your allocation between all of these types of investments in line. Not only just your stock allocation relative to bonds, but also your small cap allocation relative to your large cap allocation, or international allocation relative to your US allocation. We believe all of these assets are important to own over a long period, and you want to make sure you keep exposure to all of these assets over time.
For example, 2013 through 2015 saw very good returns in US stocks, but emerging markets, shown in the yellow squares, did not perform as well. If you did not rebalance in these few years, the allocation you had to emerging markets would have been greatly reduced, and when emerging markets recovered and really performed well in 2016 and 2017, you would not have benefited much.
You can see from this chart that the last decade has seen great performance in US large cap stocks. These are companies like Apple, Amazon, and Google. If you are not actively rebalancing, large cap stocks have certainly become an oversized portion of your portfolio. Whenever large cap stocks finally stop their period of outperformance, and have a year where they are towards the bottom of this chart, if you are heavily overweight those stocks, you will experience a much more volatile period than someone with a diversified portfolio, whose assets are spread out amongst all of these investments.
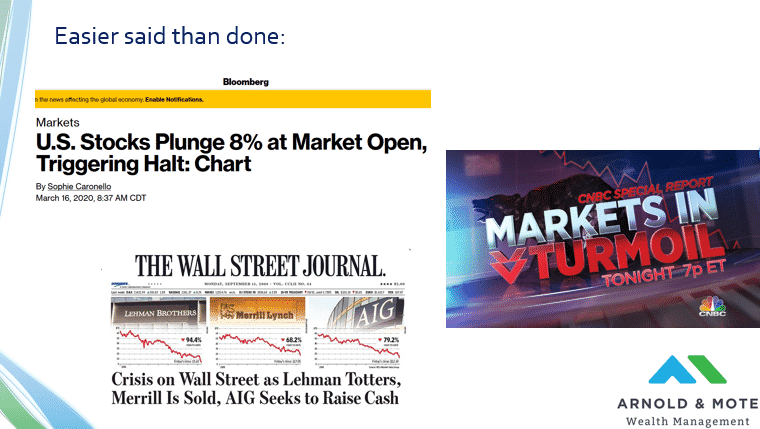
One last consideration here that is important to cover. Rebalancing tends to be needed when you see headlines like these shown here.
When the stock market declines, like 2008, or even just recently last March, you get all these scary headlines. And when stocks have these types of declines is precisely when you should be rebalancing.
But, this is also the most difficult time to think about buying stocks, but it is exactly what you should be doing. Everyone has heard the saying buy low, sell high. And buying low sometimes means buying when this is what you see on the front page of the newspaper.
But we know this is tough. On a Million dollar portfolio, this means a $50,000 or $100,000 purchase during these scary times. But, purchases at these times can actually help your portfolio recover faster than if you had done nothing. So, its really important.
Likewise, the reverse happens when the stock market goes up a lot. Today for example rebalancing might mean selling investments that have performed very well recently, like small cap stocks. It also means buying international stocks or bonds. Many are hesitant to sell investments that have done well recently, but selling high is exactly what you should be doing for long term success. And we know rebalancing is important for the long term safety of your investment portfolio.
We wanted to do this webinar to give you a look into what we do in your investment portfolio, and because we want you to understand what is happening when we send you an email that we have placed trades to rebalance your account.
And while there are special one-time scenarios where we do these checks, March 2020 is an example. More often these are checks we are doing as you contribute and as you make withdrawals from your accounts.
If you are taking $3,000 per month withdrawals from your accounts, we might be able to sell some of the investments that have done well recently and be able to avoid larger rebalancing trades. So, we are still keeping your accounts in balance, but you might not notice as many large trades for us to do so.
We also like you to know that this is a strategy that is very rules based. We do not make these trades because Quinn thinks the stock market is going up or down in the future. There are a set of tolerances for your different investments, like those tolerance bands we talked about in an earlier slide, and rebalancing decisions are made based on that.
As that asset quilt in a previous slide showed, there can be a lot to consider in these rebalancing decisions. There are many different pieces to keep in balance at once. We use some tools that are provided by Schwab to help monitor your portfolio and calculate these trades.
Need help managing your investments? Reach out today to schedule a free, no-obligation 30 minute meeting to see how we help our clients invest successfully.